
Workbench in depth.
Run queries from the dashboard covers what to type. This page covers the tool around it: how to keep several queries open at once, how to find a column name without leaving the editor, and what each of the seven results tabs is actually for.
The layout.
Three regions, fixed to the viewport - the panes scroll inside themselves rather than scrolling the page:
- Left rail - the live schema for the selected instance, grouped by namespace.
- Top right - editor tabs, the action bar (LANG switcher, SAVE, RUN), and the editor itself with a line gutter and syntax highlighting.
- Bottom right - the results panel: seven tabs on the left, run status and Copy JSON on the right.
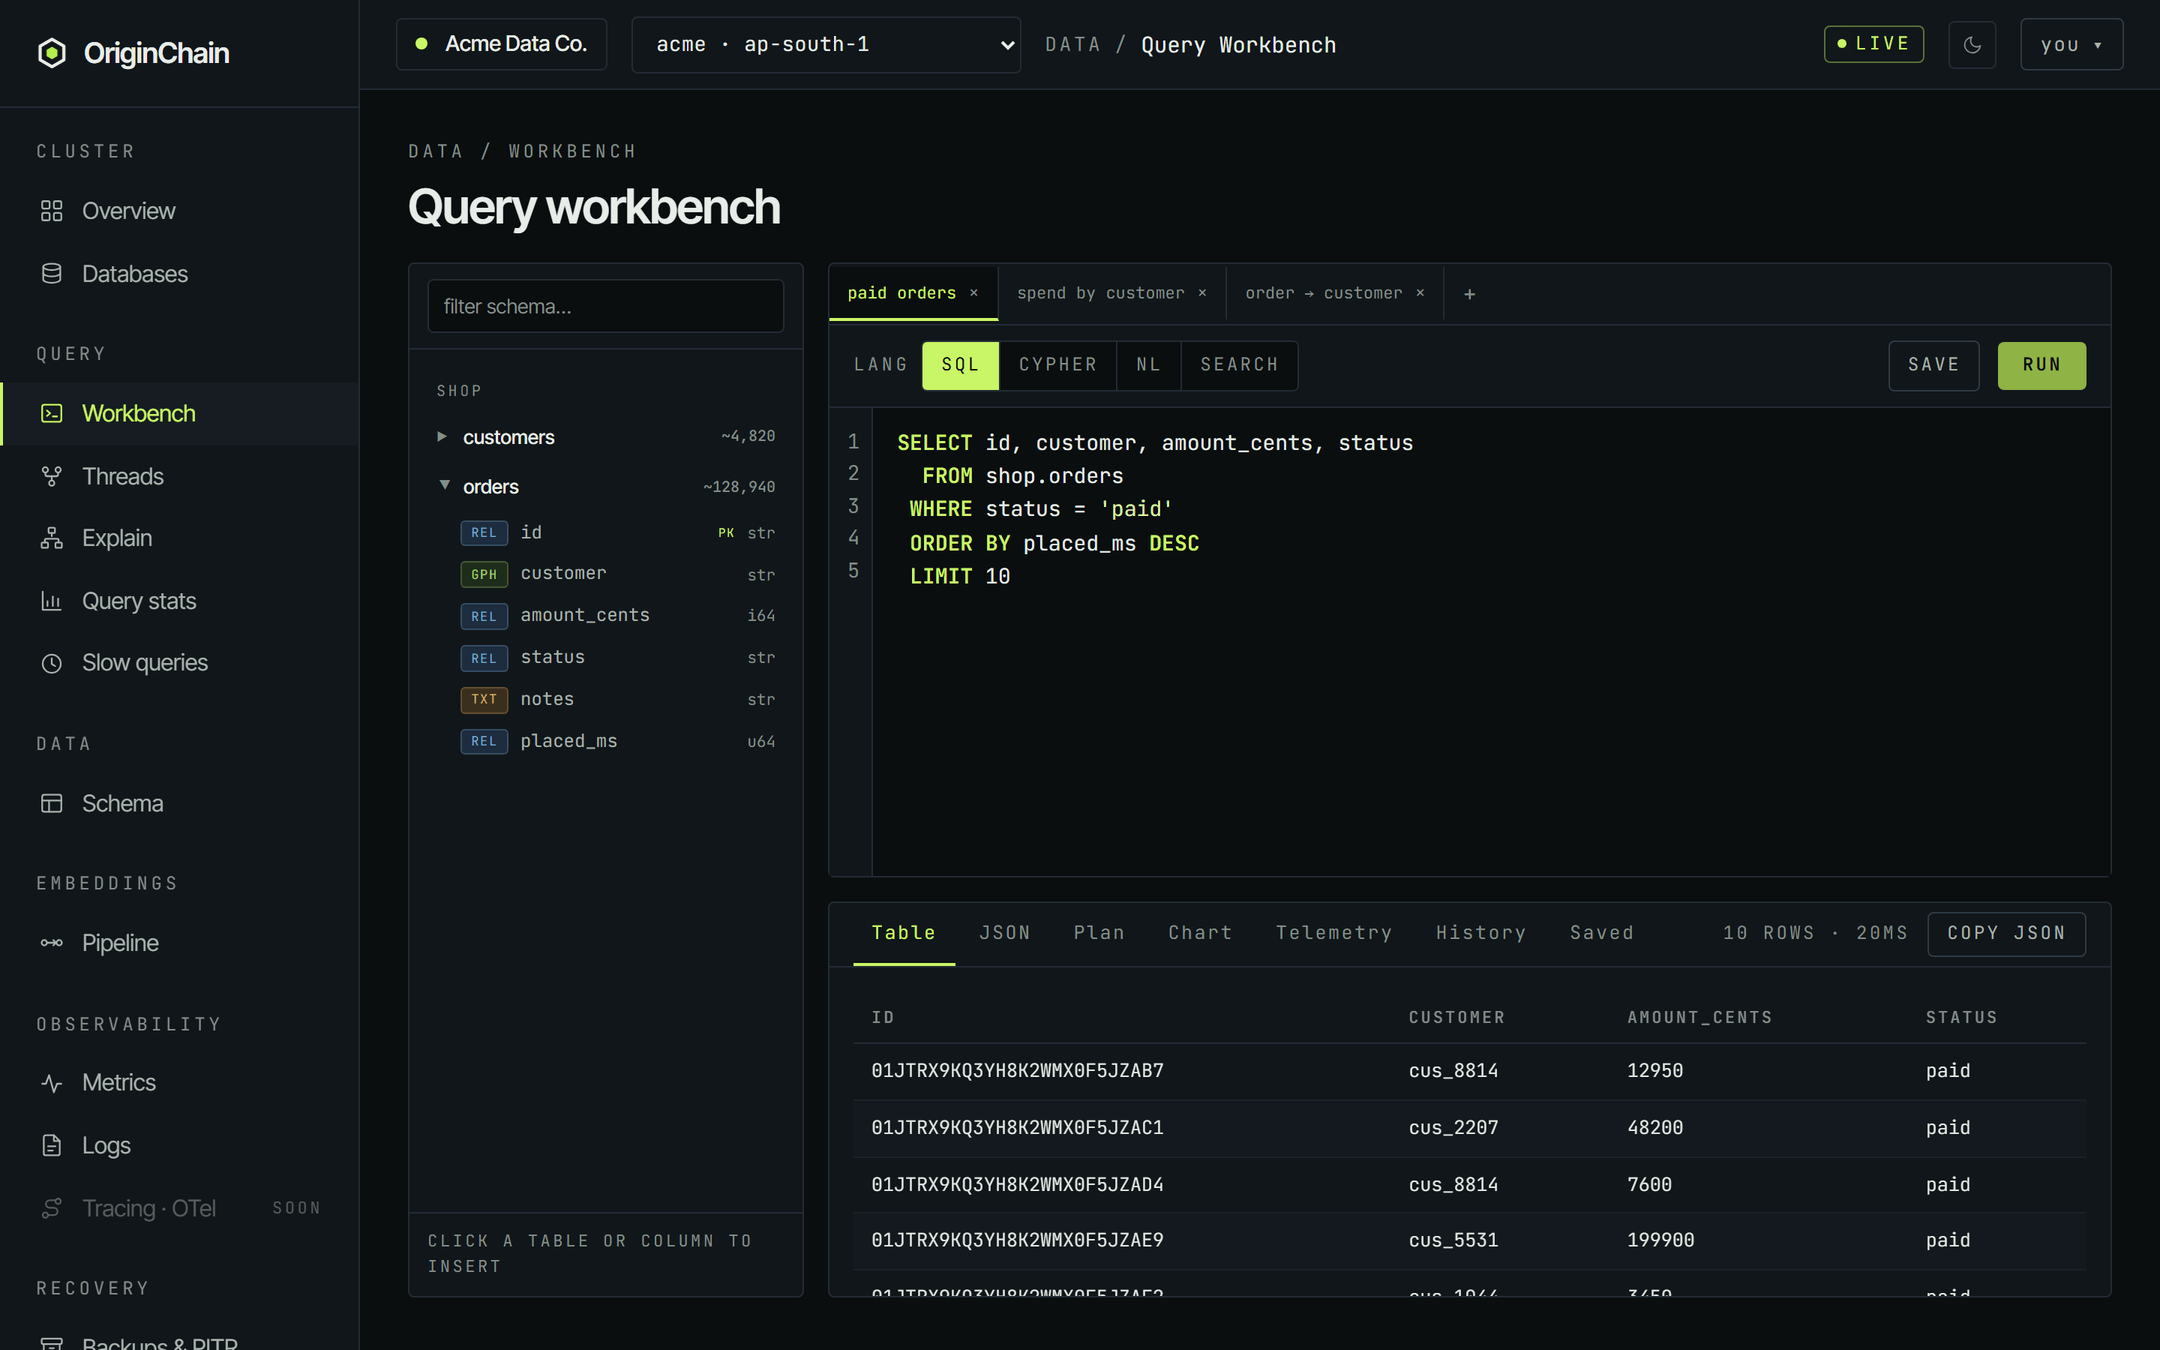
The run status sits between the tab row and Copy JSON: idle before the first run, running… while a query is in flight, then the row count and elapsed round-trip. Problems - an empty editor, no instance selected, an error from the engine - are reported there too, in red.
The schema rail.
Tables are grouped under their namespace, each with an approximate row count (the ~ is literal - it is a maintained estimate, so run COUNT(*) when you need the exact number). Expand a table and every column is listed with a kind chip, a PK marker on the primary key, and its declared type on the right.
| Chip | What that column is for |
|---|---|
| REL | An ordinary relational column - query it with SQL. |
| TXT | Indexed for full text - a valid field for Search mode. |
| GPH | A relation to another table - the column name is the relation type you hop with in Cypher. |
| VEC | A vector column. Standalone vector tables are listed separately at the bottom of the rail with their vector count. |
The filter box at the top narrows the rail as you type, matching both table ids and column names, and auto-expands any table whose columns matched. It is the fastest way to answer "what was that column called".
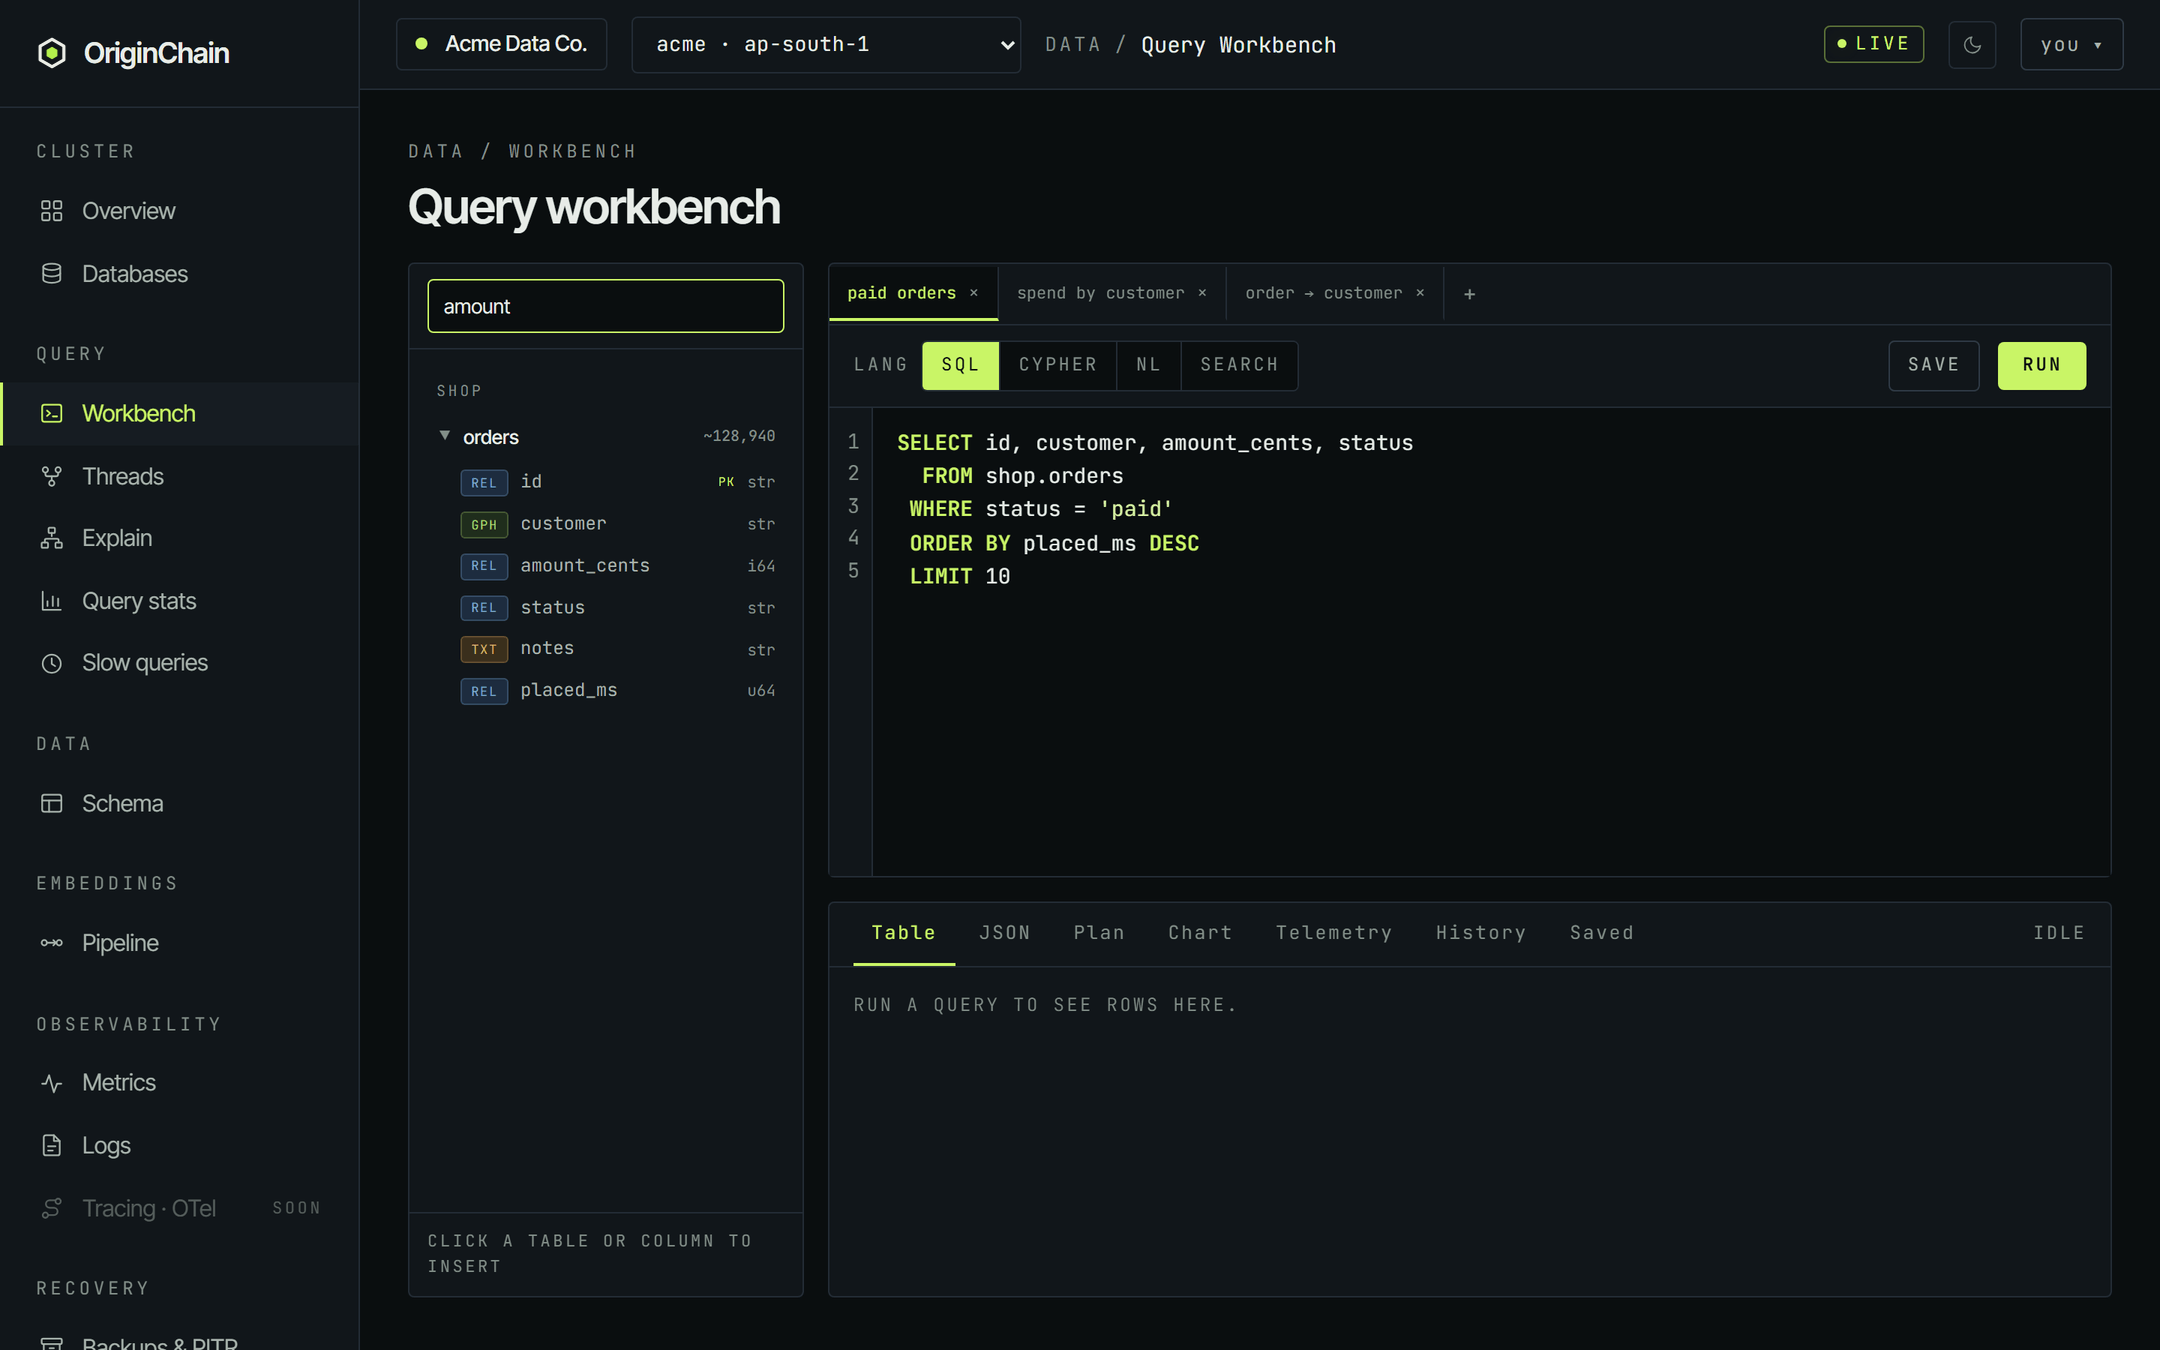
Clicking a table name inserts its fully-qualified id (shop.orders) at the editor caret; clicking a column inserts the bare column name. To expand a table without inserting anything, click the caret triangle rather than the name.
Editor tabs.
Each tab holds its own text and its own LANG selection, so you can keep a SQL aggregate and a Cypher hop side by side and flip between them without retyping either.
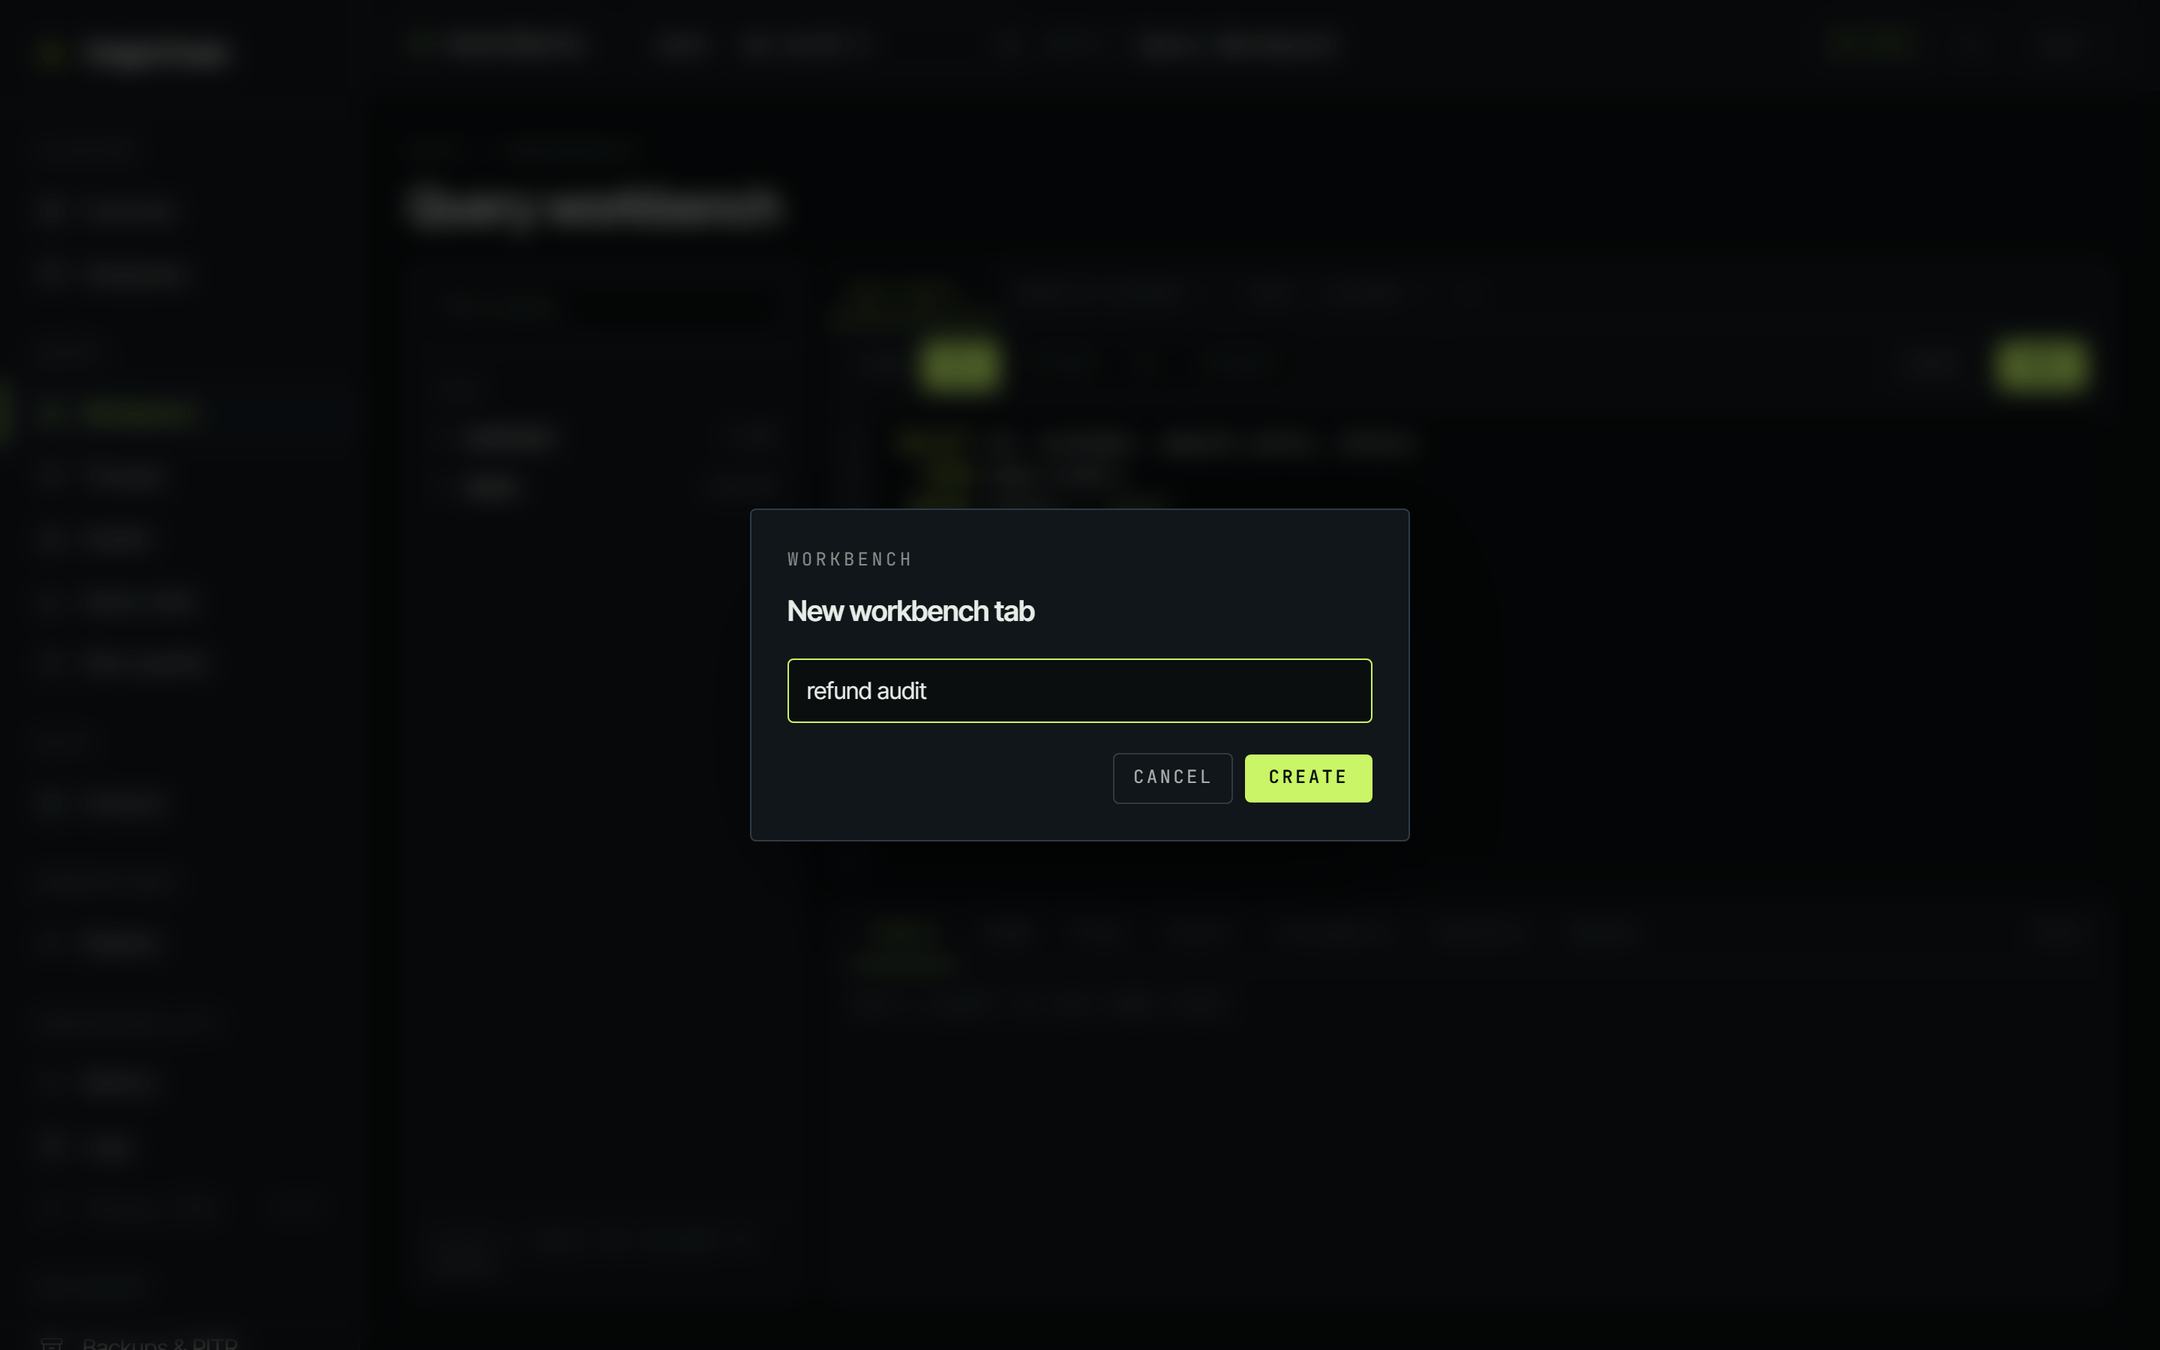
- + at the end of the strip opens a dialog asking for a name, then creates the tab.
- Double-click a tab to rename it.
- The × on a tab closes it. There is no undo, so save anything you want to keep first.
Your open tabs, their names, their languages and their text are stored against your account - not just this browser - so the workbench you left open on one machine is the workbench you come back to on another.
The seven results tabs.
| Tab | What it is for |
|---|---|
| Table | Reading the rows. Paged. |
| JSON | The raw response your application would get. |
| Plan | A placeholder in the current console - see below. |
| Chart | A quick bar chart of the result, when it has a numeric column. |
| Telemetry | How this query has behaved across every run, not just this one. |
| History | What you ran recently. Click to reload it into the editor. |
| Saved | Queries you deliberately kept, under a name. |
Table - and its pager.
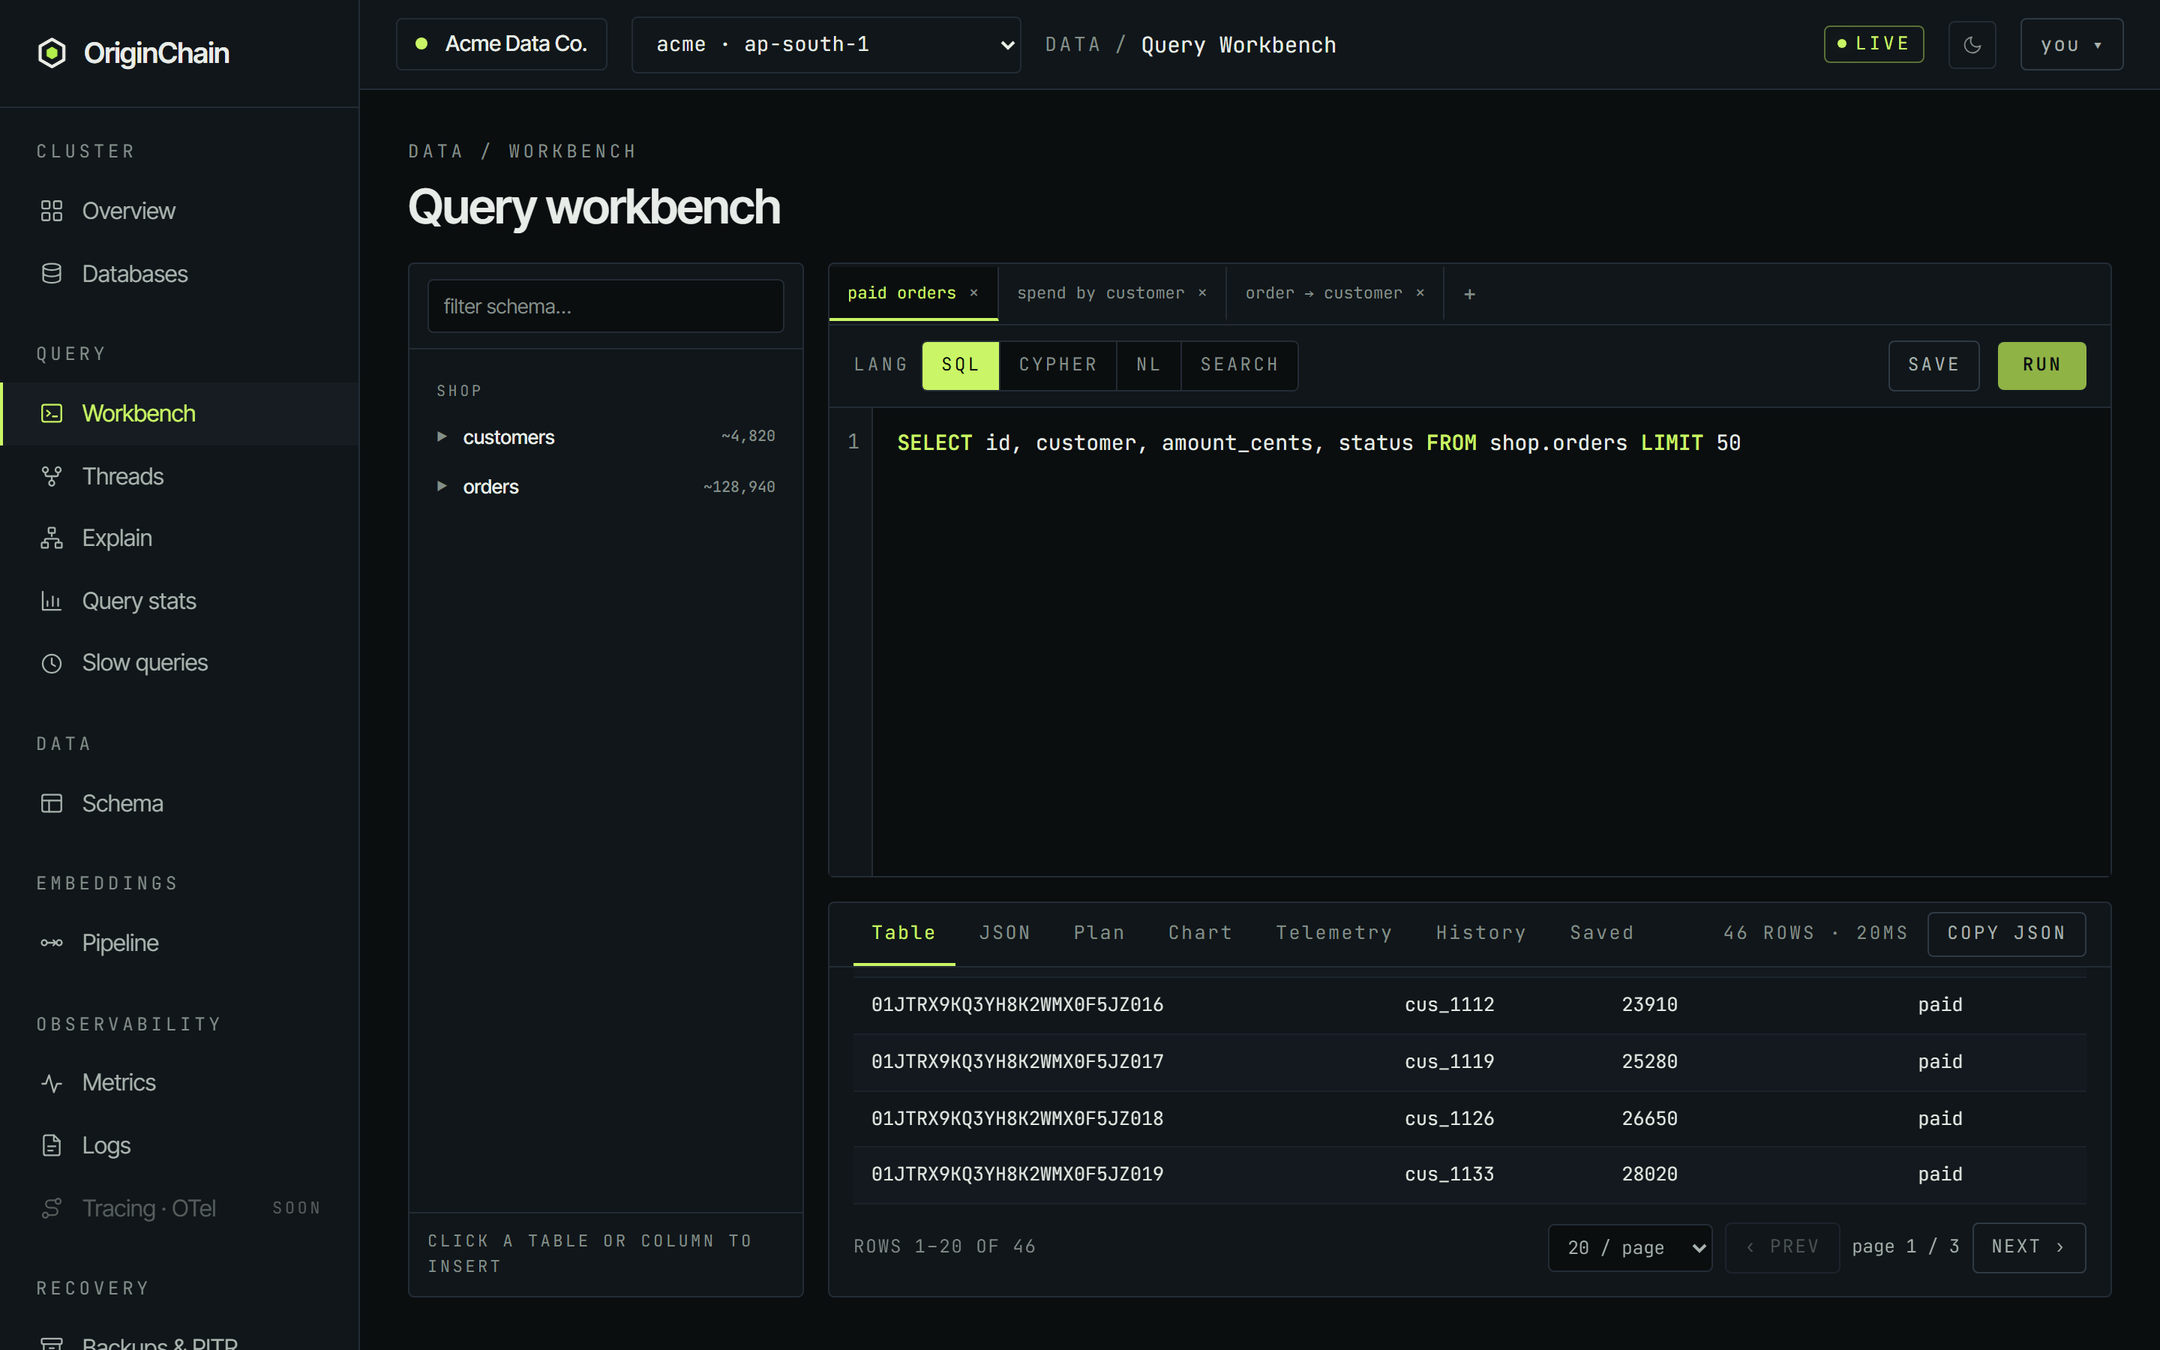
The Table tab windows the result rather than rendering a thousand rows into one endless scroll. Scroll to the bottom of the pane for the pager: a rows-shown-of-total readout, a page-size select (10, 20, 50 or 100 - the default is 20, and your choice sticks), and prev / next. The full result set stays in memory - JSON, Copy JSON and Chart all see every row, not just the visible page. A new run always resets you to page 1.
Plan - not filled by the workbench.
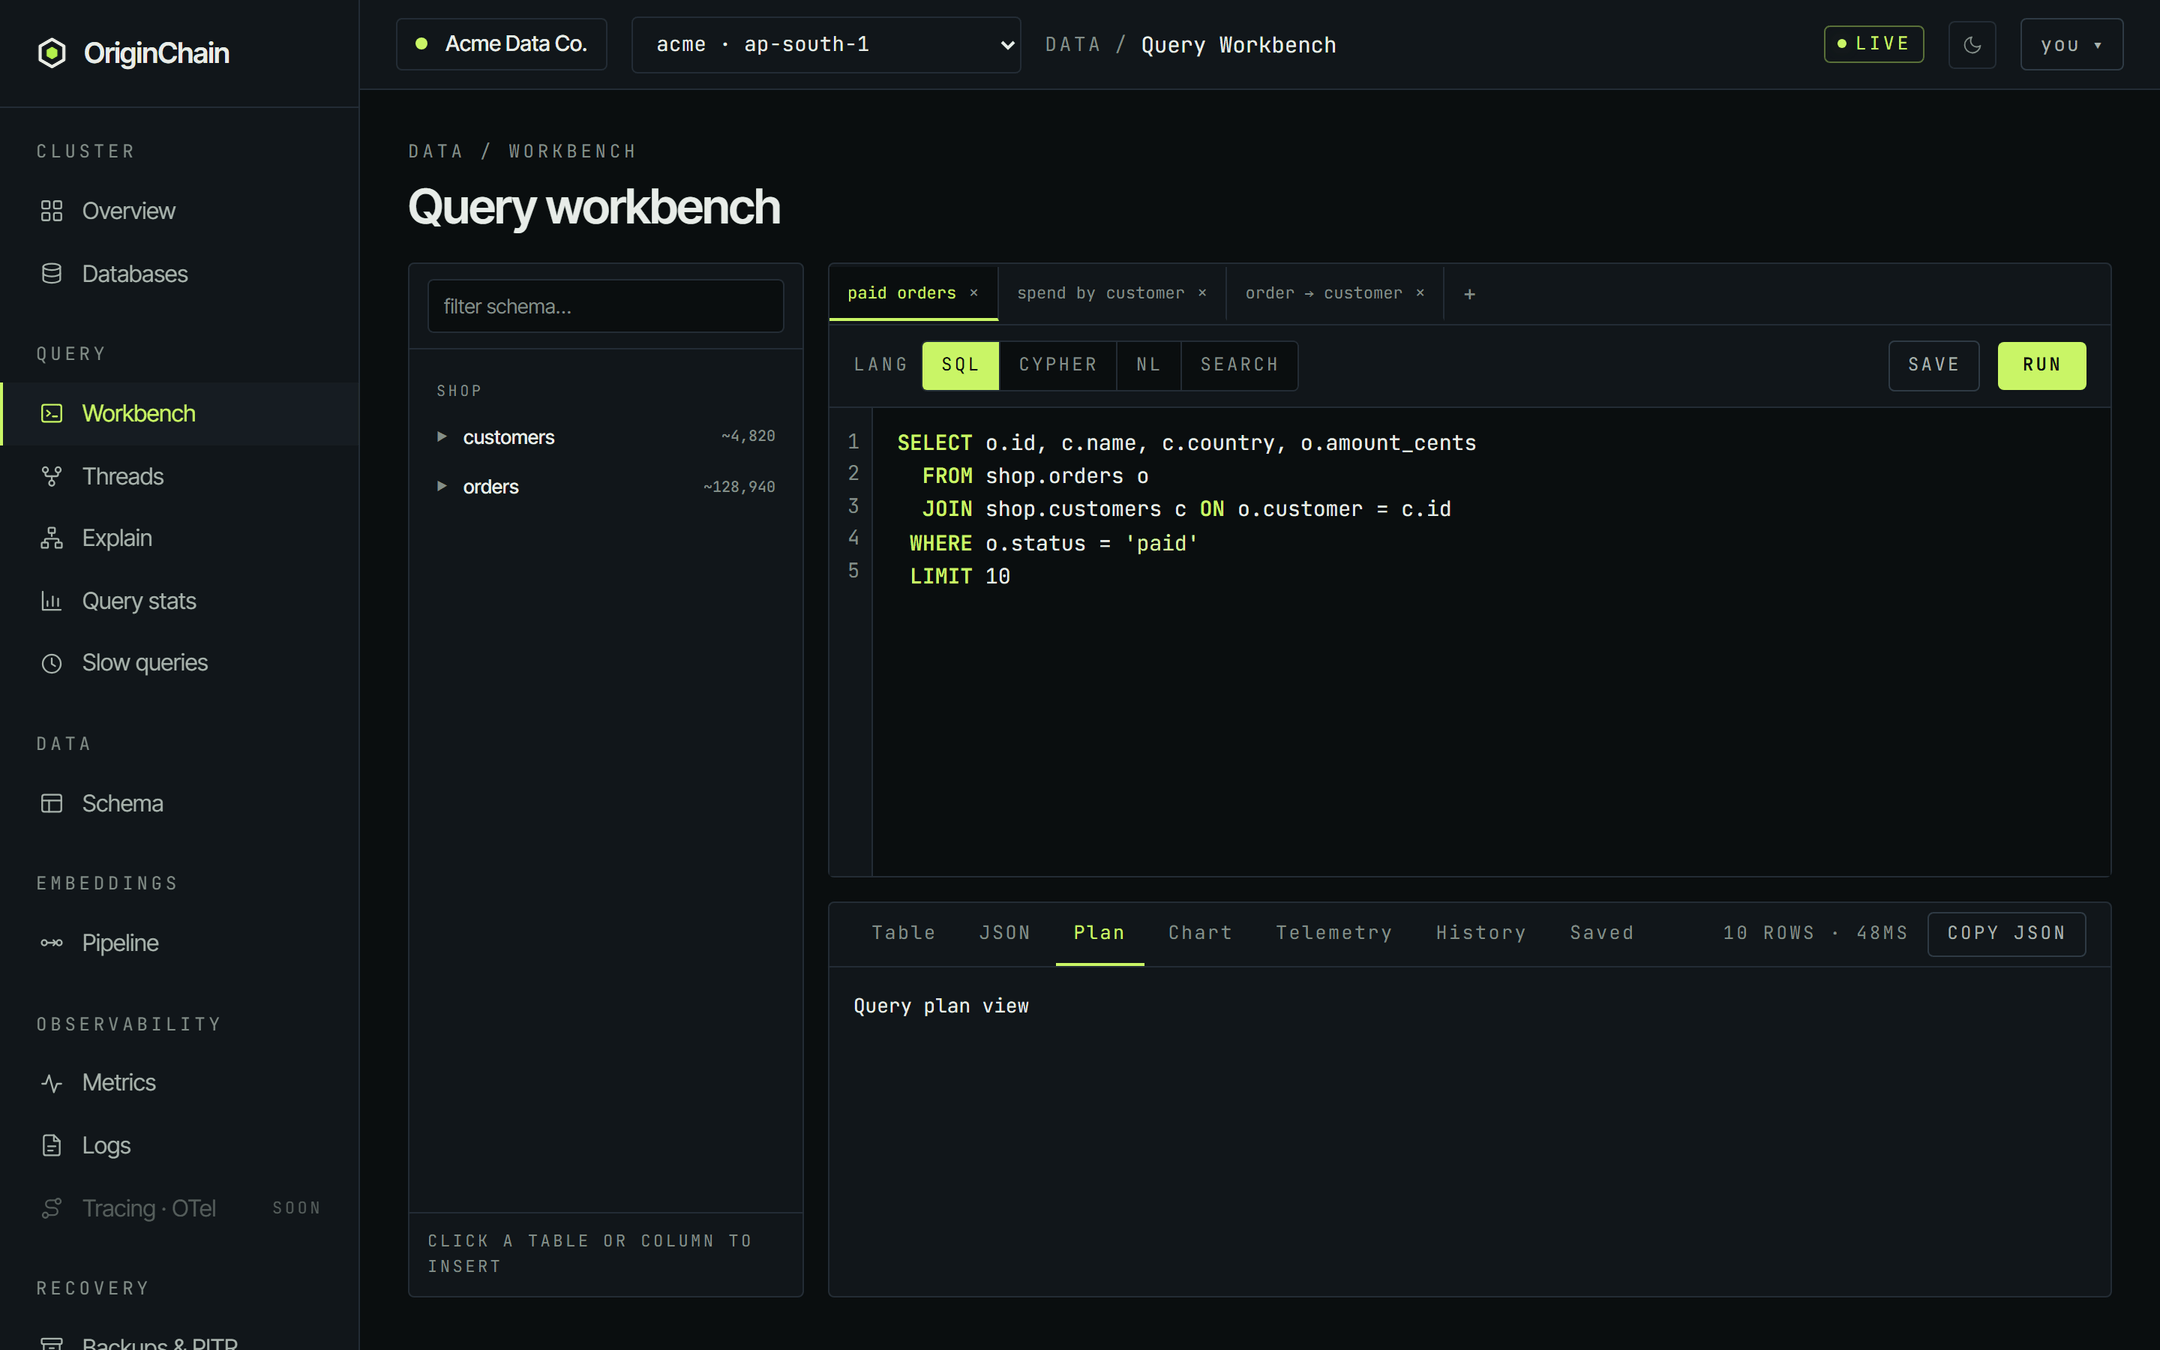
Be aware of this one. The Plan tab exists in the tab strip but the current console never populates it - select it after a run and it reads Query plan view, which is placeholder text, not your plan. The workbench used to carry EXPLAIN buttons; they were removed. To see how a query executes, use the dedicated Explain page under Query in the sidebar.
Telemetry.
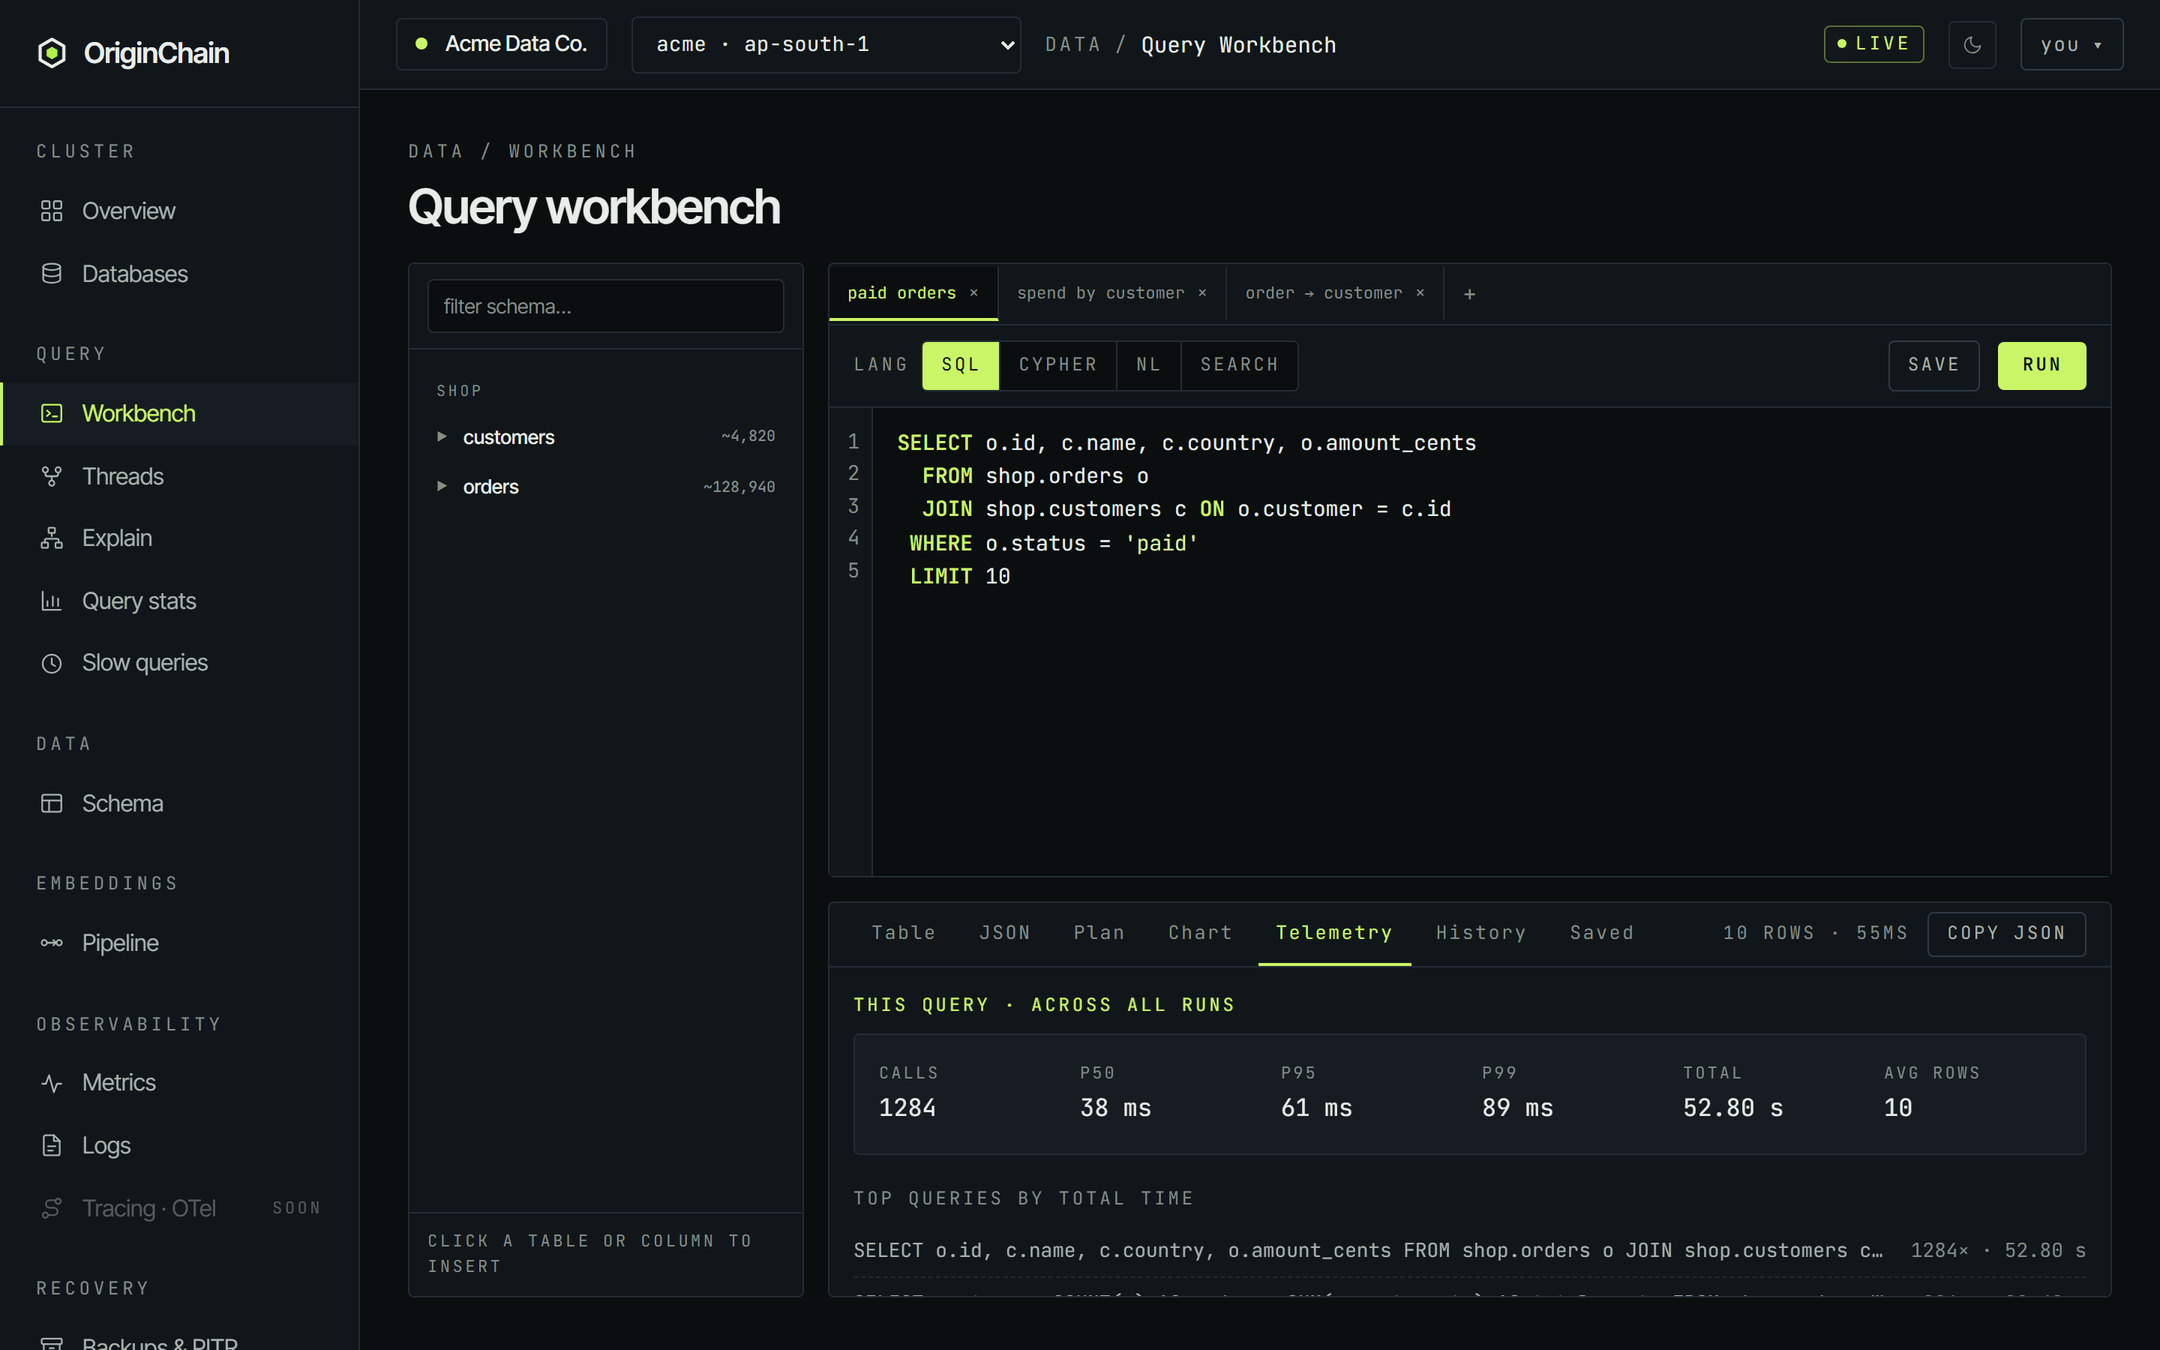
The most under-used tab. It takes the query you just ran, normalises it to a fingerprint (literals stripped), and looks that fingerprint up in the engine's query registry - so you get calls, p50, p95, p99, total time and average rows across every run of that query, by anyone, not just the one you triggered. Below that sits the instance's top queries by total time, and a link through to the full Query stats page.
If you have not run the query yet in this session the panel says so rather than guessing.
History.
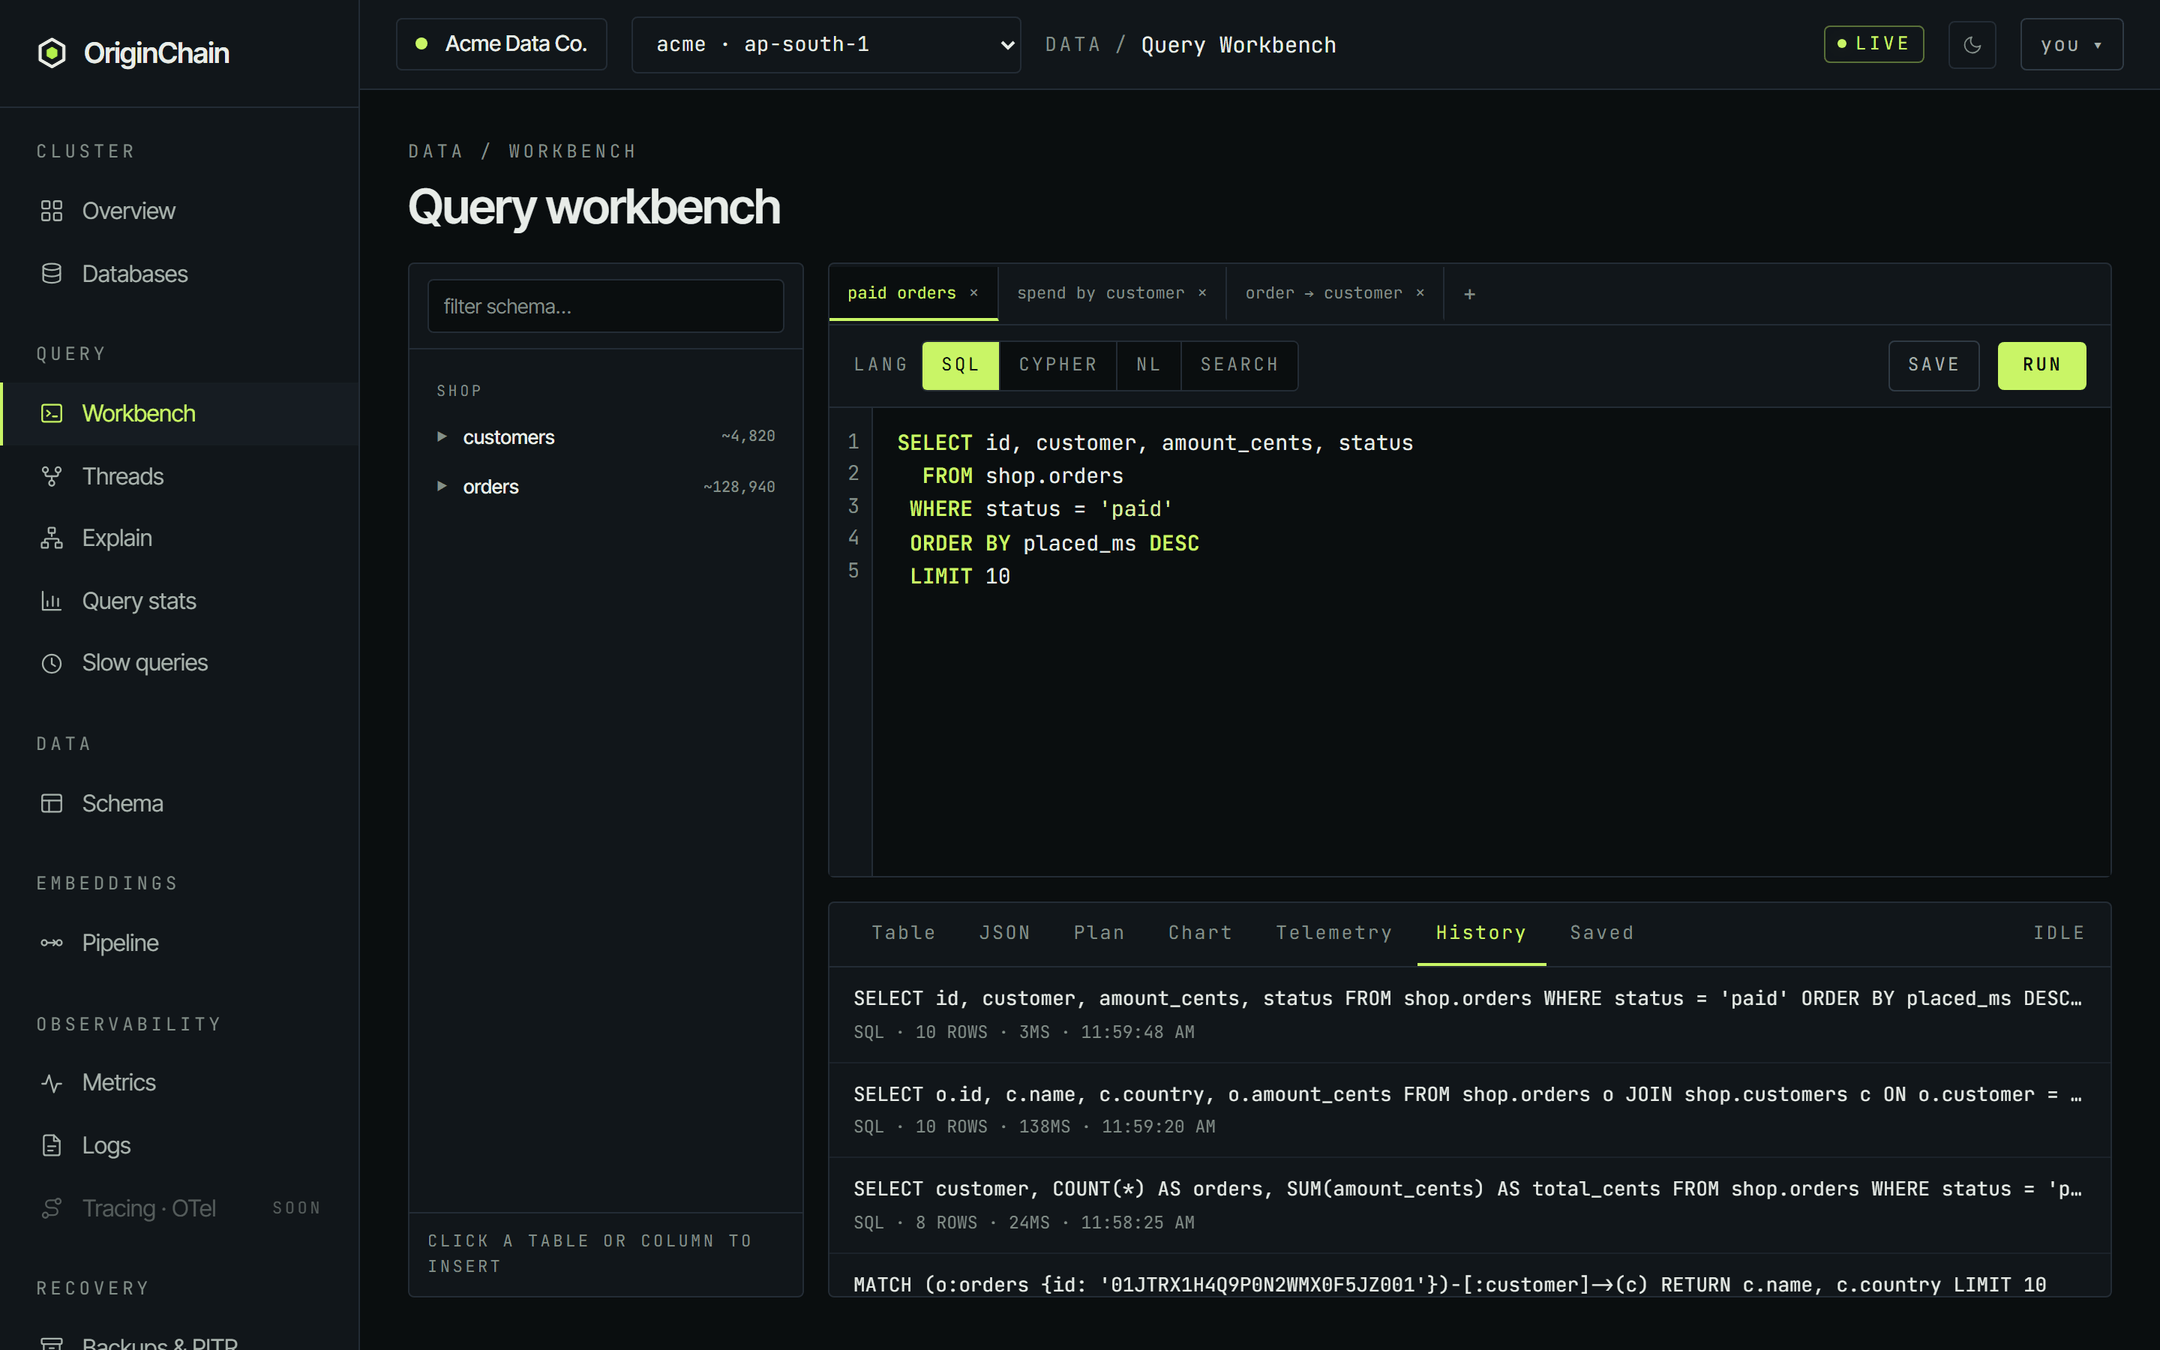
Every run is logged - the query text on one line, then its language, row count, elapsed time and the time of day. Click any entry to load it back into the current tab, language and all. History is capped at the most recent 100 runs.
Saved.
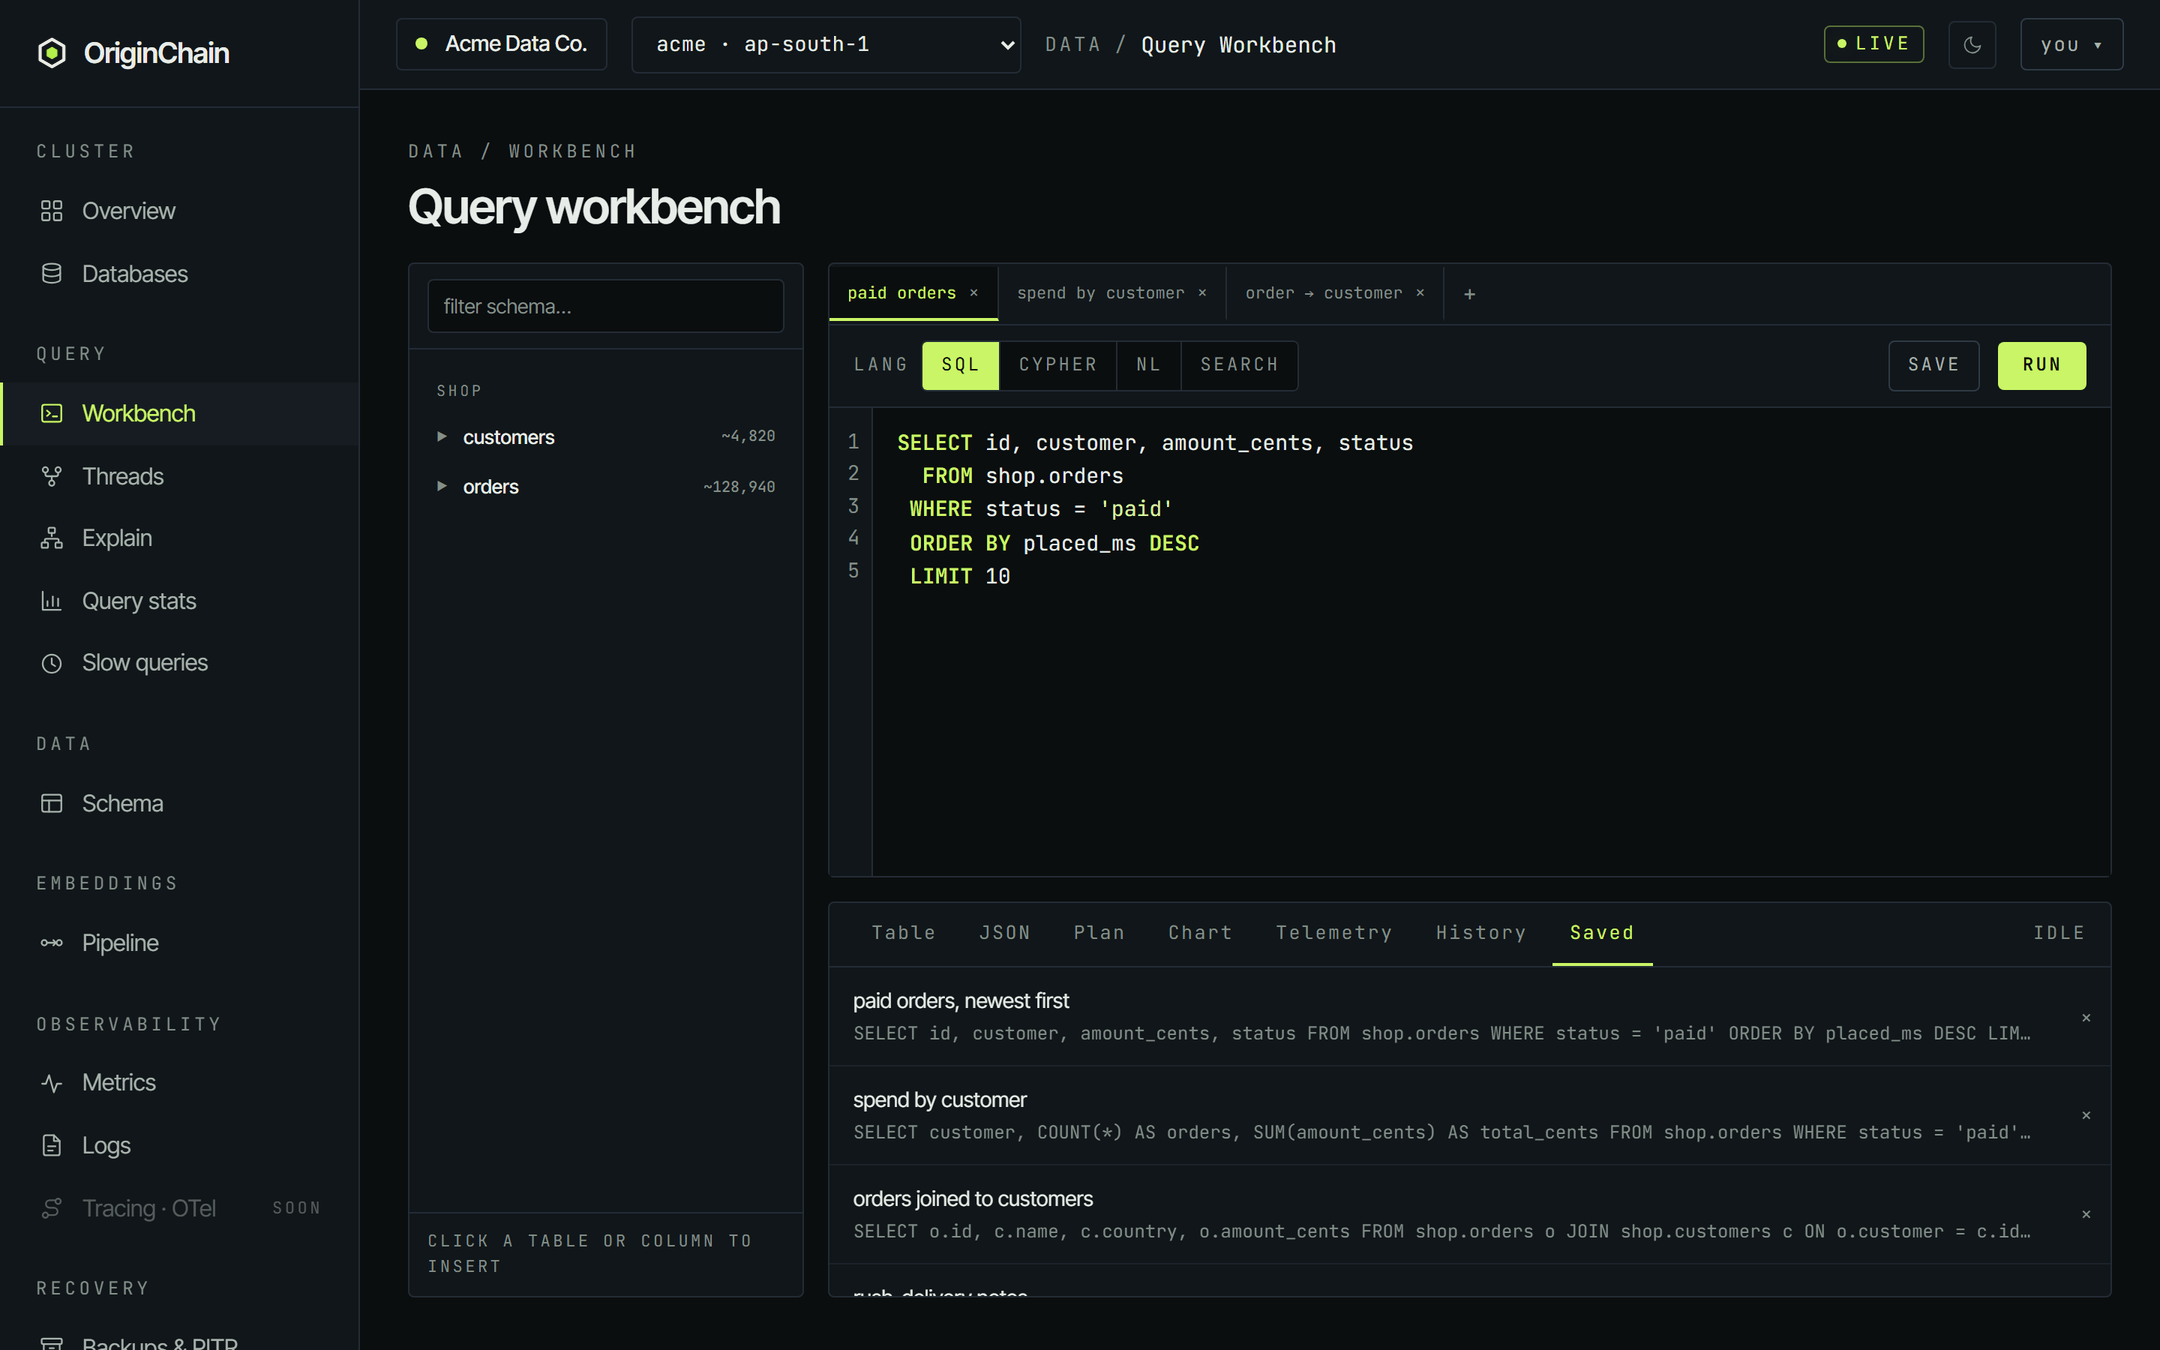
The named list. Click an entry to load it into the current tab; the × on the right deletes it.
Saving and re-opening.
- Get the query right in the editor.
- Click SAVE. A dialog asks for a name - leave it blank and the first part of the query is used.
- The panel jumps to Saved so you can see it landed.
Saving records the text and the language, so re-opening a saved Cypher query puts LANG back on Cypher for you. Saved queries and history are stored per account, so they follow you between machines - and they are never visible to another account sharing the same browser.
A saved query is a bookmark, not a job. Nothing runs it on your behalf and nothing alerts on its result - it is there so you do not have to retype it.
Which instance you are hitting.
There is no instance picker on the workbench itself. The target is the one in the top bar, next to your account name, labelled name · region. You choose it once and every page in the console - workbench, Explain, Query stats, Slow queries, Schema - reads the same choice.

Three things worth knowing about it:
- Changing it reloads the page, so the schema rail and results re-fetch against the new instance. Anything unsaved in the editor is kept; the results panel is cleared.
- Only instances that are running (or still provisioning) appear. If the list is empty the workbench says so instead of failing on a run.
- A
?instance=parameter on the URL wins for that page load and becomes the remembered choice - which is how the open links on the Query stats page land you on the right database.
Working habits.
Keep narrowing the query in the tab you are working in - History has every version you ran, so you can always step back to the one that worked. When you want to try a genuinely different shape, open a new tab rather than overwriting the one you like.
Put a LIMIT on while you are shaping a query and raise it once the columns are right. The workbench holds the whole result in the browser, so a careless unbounded select on a large table is slow for you and expensive for the instance.
Copy JSON puts the entire result on your clipboard, formatted, whichever page the table is showing. Selecting the rendered table only gets you the visible page.
Once a query is right, it belongs in code. Move to the SDKs or the HTTP API as soon as you need bound parameters, pagination over more rows than you want in a browser, vector search, or anything that has to run on a schedule. The JSON tab shows you exactly what your client will receive.