
Navigate your database.
You have a running instance. This page is the map: the chrome that wraps every console screen, what each group in the sidebar is for, and what lives behind each tab on an instance. If you're looking for your endpoint, your tenant id, or the IP access list, jump to the tabs.
The top bar.
The same strip sits above every console page. Left to right:

| Control | What it does |
|---|---|
| Account pill | Who you're signed in as - your organisation name if you have one, otherwise your email. It's a label, not a switcher. |
| Instance picker | The active instance, labelled name · region. Choose once here and every page reads it - Workbench, Schema, Backups, Metrics. Changing it reloads the page so it re-fetches against the new instance. With no instances yet it shows a disabled no instances. |
| Breadcrumb | Section and page you're on. |
| LIVE | Whether the console reached our API. It starts neutral at connecting…, turns green LIVE once the API answers, and red OFFLINE if it doesn't. It reflects the OriginChain API, not the health of your instance - that's the badge on the instance itself. |
| Theme toggle | Flips light and dark. The choice is remembered in your browser. |
| User menu | Shows the account you're signed in as, with links to Settings and Billing, and Sign out. |
If a page looks like it's showing the wrong database, check the picker first. It is the single selection the whole console shares - there are no per-page instance dropdowns.
The sidebar map.
Eight groups, top to bottom. Entries marked SOON are placeholders - they're greyed out and can't be opened yet.
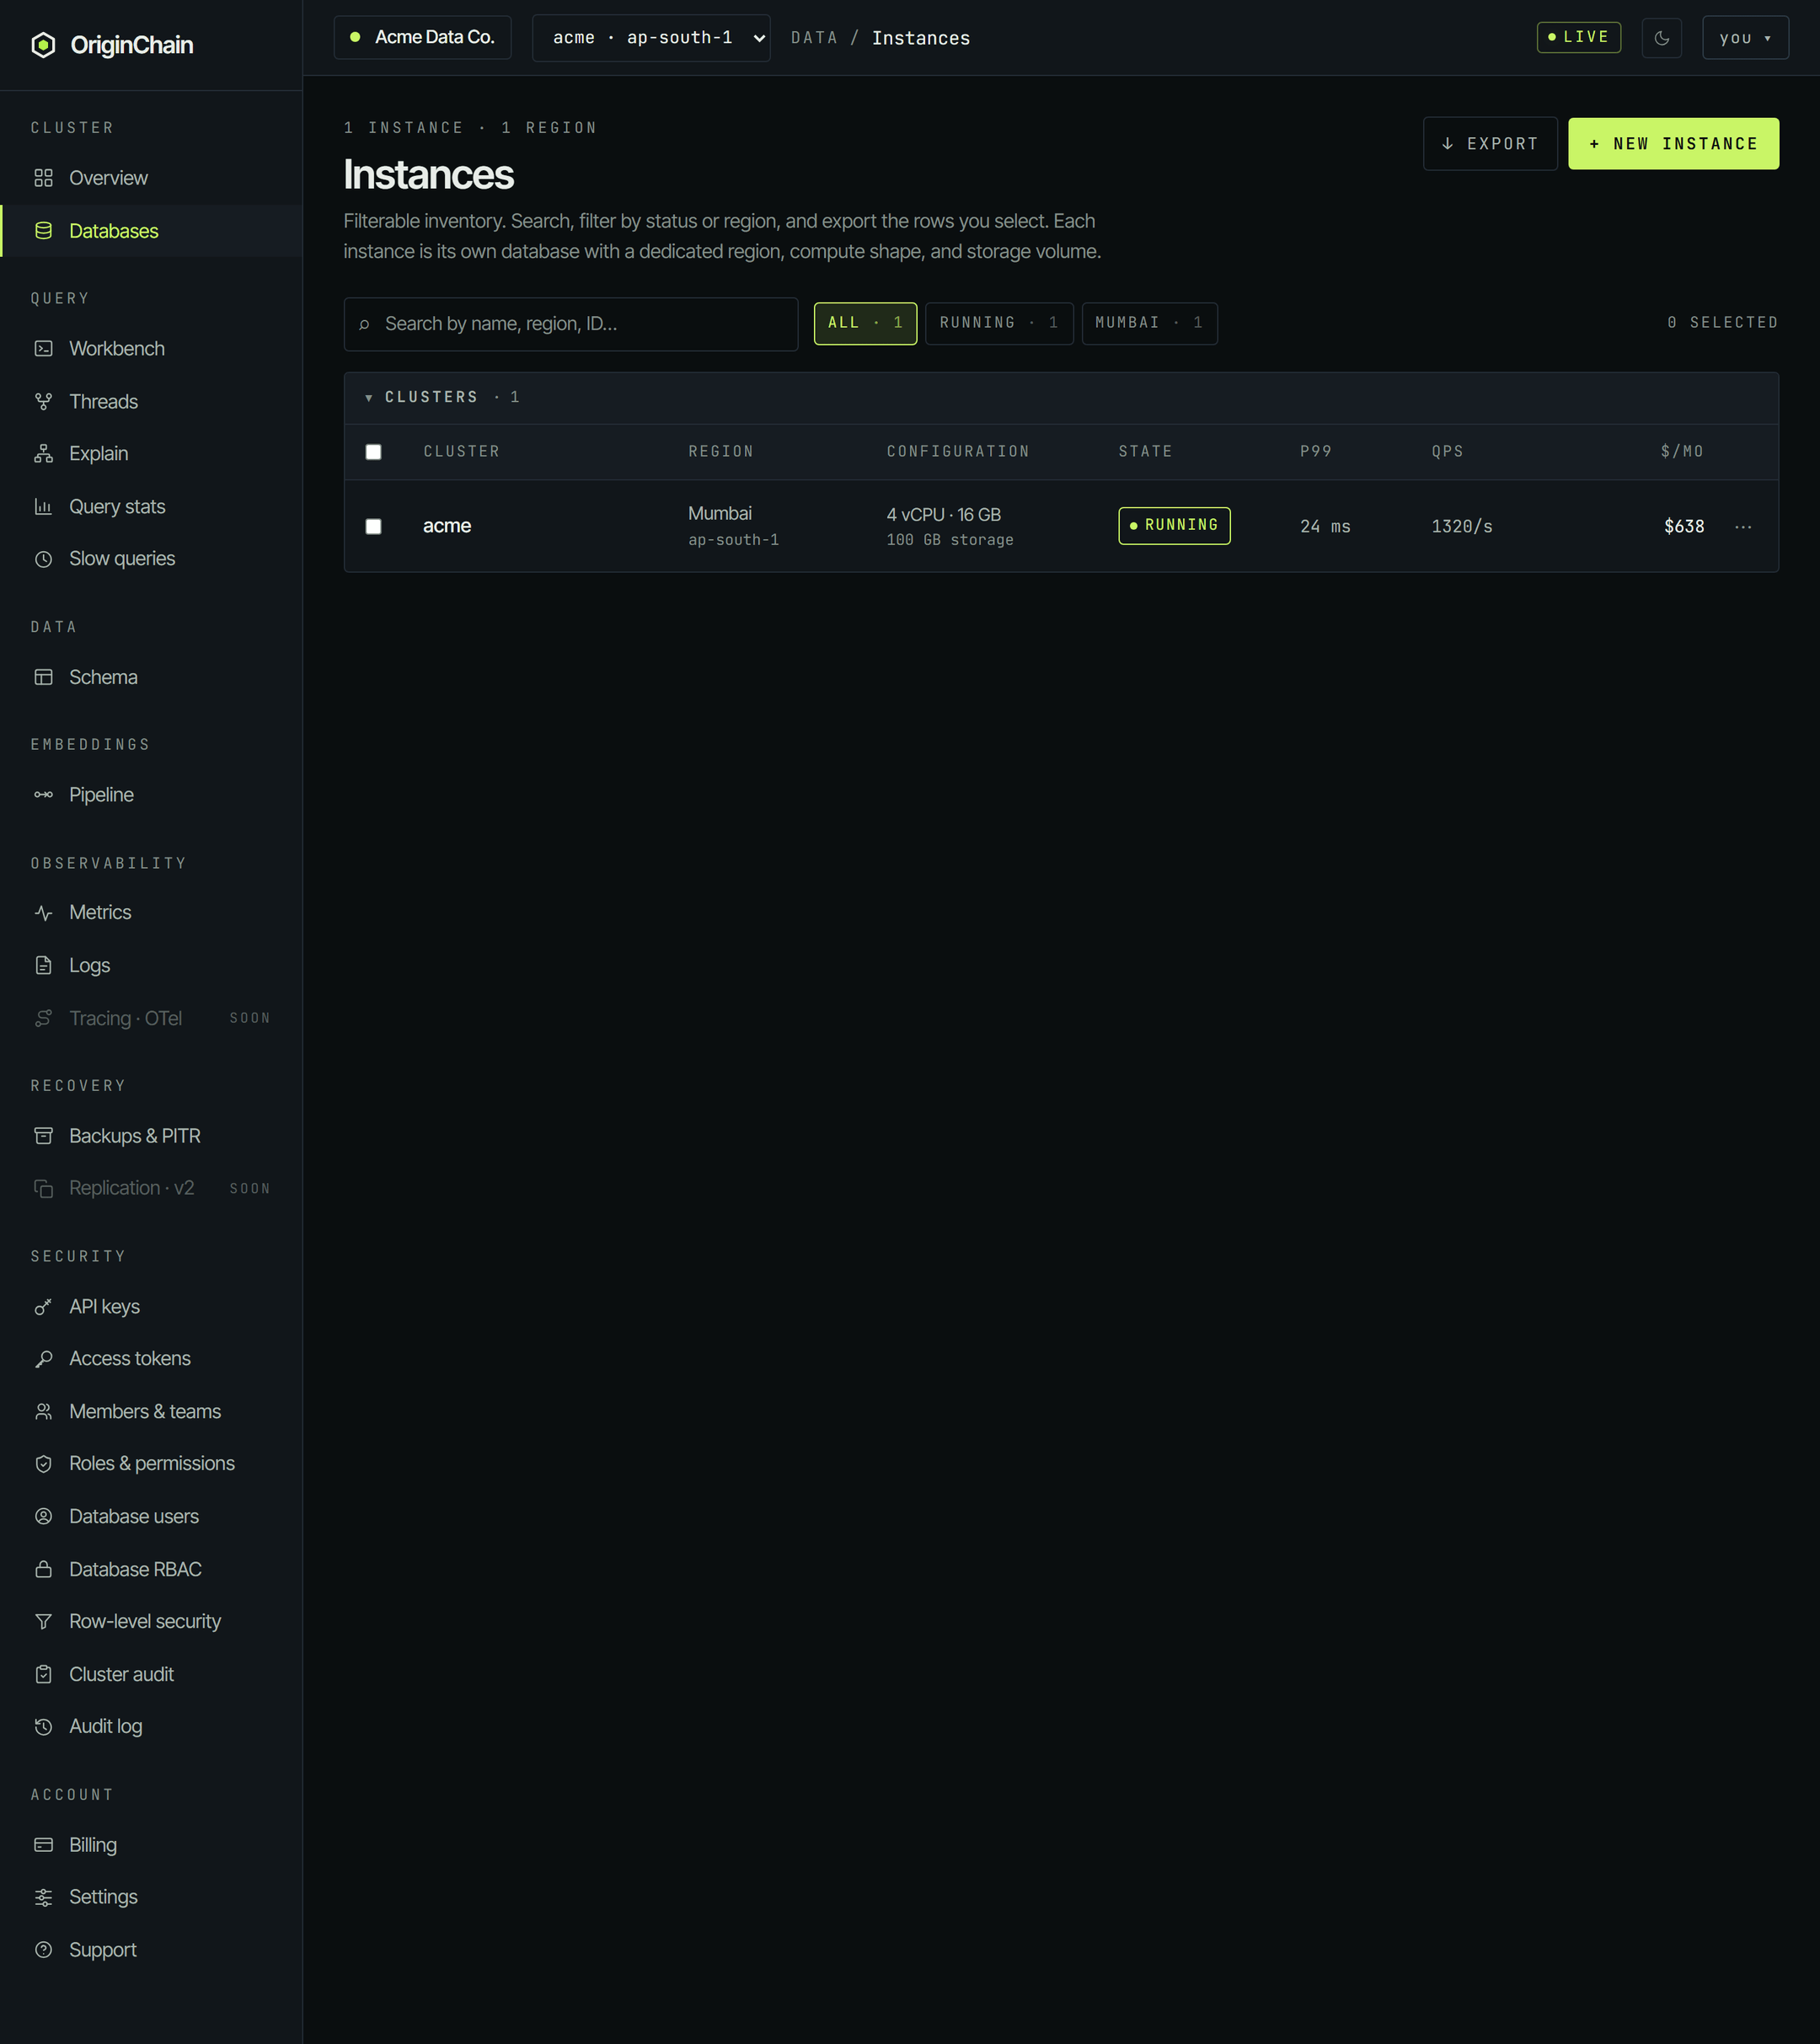
| Group | Entries, and what each is for |
|---|---|
| Cluster | Overview - the account dashboard. Databases - your instance inventory. |
| Query | Workbench - run queries against the active instance. Threads - what's executing right now. Explain - the plan behind a query. Query stats - aggregate query behaviour. Slow queries - the ones worth looking at. |
| Data | Schema - register, browse and edit your tables. |
| Embeddings | Pipeline - how text becomes vectors on this instance. |
| Observability | Metrics - throughput, latency, errors over time. Logs - engine logs. Tracing · OTel - SOON.
|
| Recovery | Backups & PITR - snapshots and point-in-time recovery. Replication · v2 - SOON.
|
| Security | API keys and Access tokens - credentials for reaching your data. Members & teams and Roles & permissions - who can use the console, and what they can do in it. Database users, Database RBAC and Row-level security - identities and rules inside the database itself. Cluster audit and Audit log - what happened, and who did it. |
| Account | Billing, Settings, Support. |
Almost every one of these pages reads the instance picker, so they follow you as you switch databases. The exceptions are the account-level pages - Members, Roles, Billing, Settings - which belong to the organisation, not to one instance.
The instances list.
Databases is a filterable inventory. Each row is one database, with its region, configuration, state, live P99 and QPS, and monthly cost.
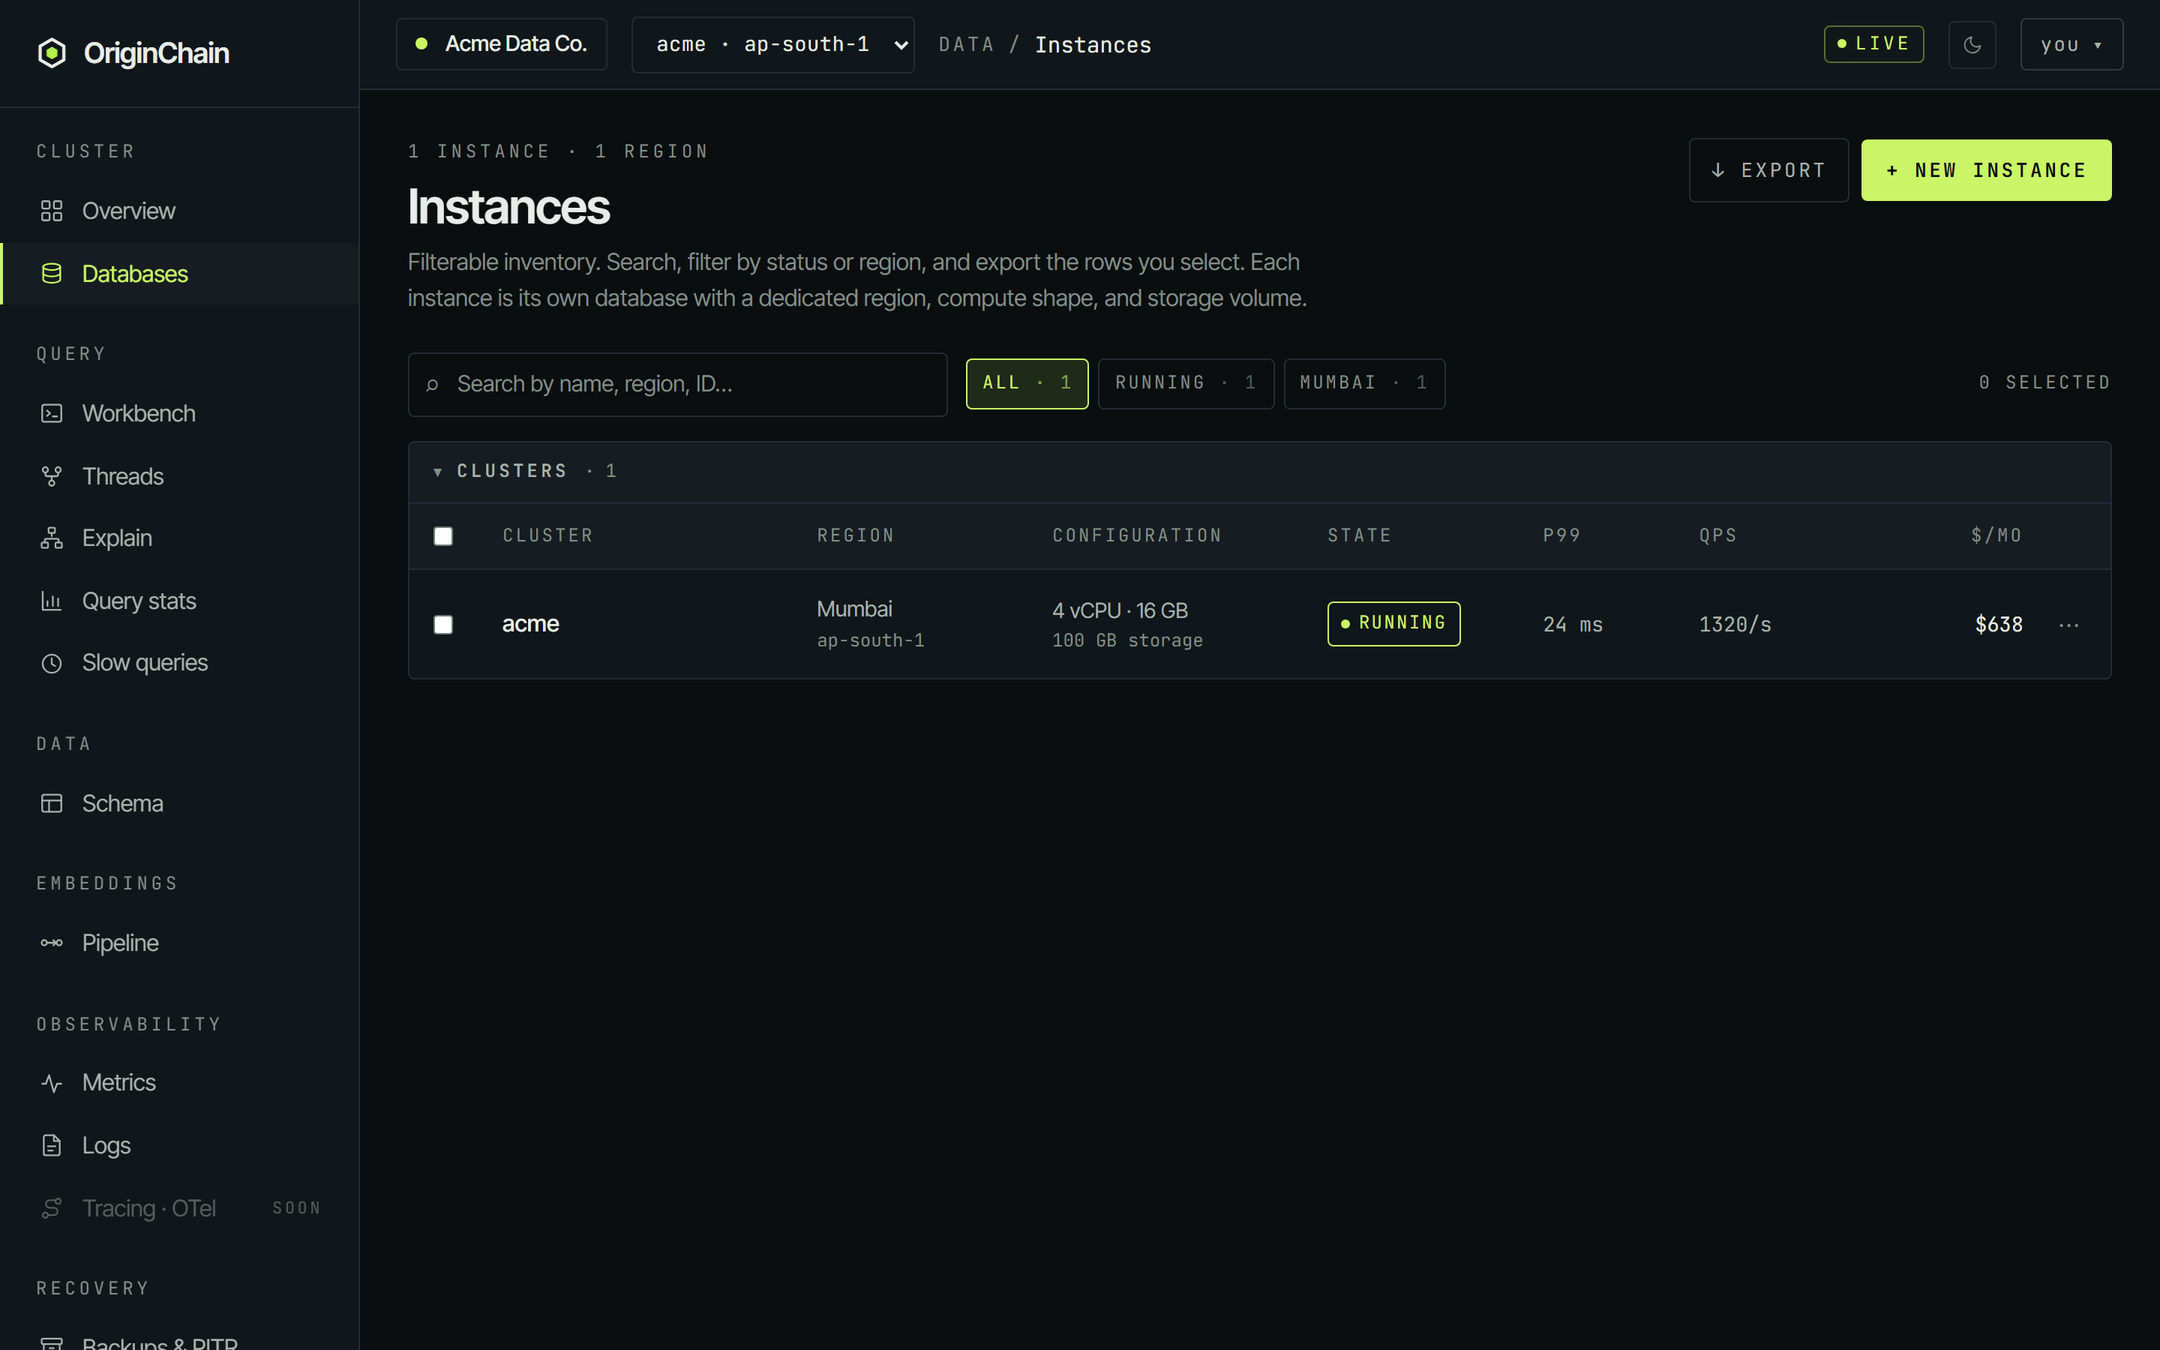
- Search matches on name, region and instance id.
- Filter chips are generated from what you actually have - an
ALLchip, one per state in use, and one per region in use, each with a count. - Export writes a CSV of the rows you've ticked, or of everything currently visible if you've ticked nothing.
- Clusters, above the header row, collapses the whole table. The state is remembered per browser.
- The ⋯ at the end of a row opens that instance - the same as clicking its name. It isn't a menu.
A few states read differently from the raw status. A free database that has scaled to zero shows as IDLE, not RUNNING - that's expected. An instance being torn down shows as DELETING and stays in the list until it's gone.
The instance detail tabs.
Open an instance and you get its name, region, instance id, a state badge, and seven tabs. Add-ons is hidden on a free database, which has none.
Overview
Four configuration cards - Compute, Storage, Resilience & scale, Region - with the monthly figure for compute and storage on the cards themselves. Under them, a one-line add-ons summary with a shortcut to the Add-ons tab.
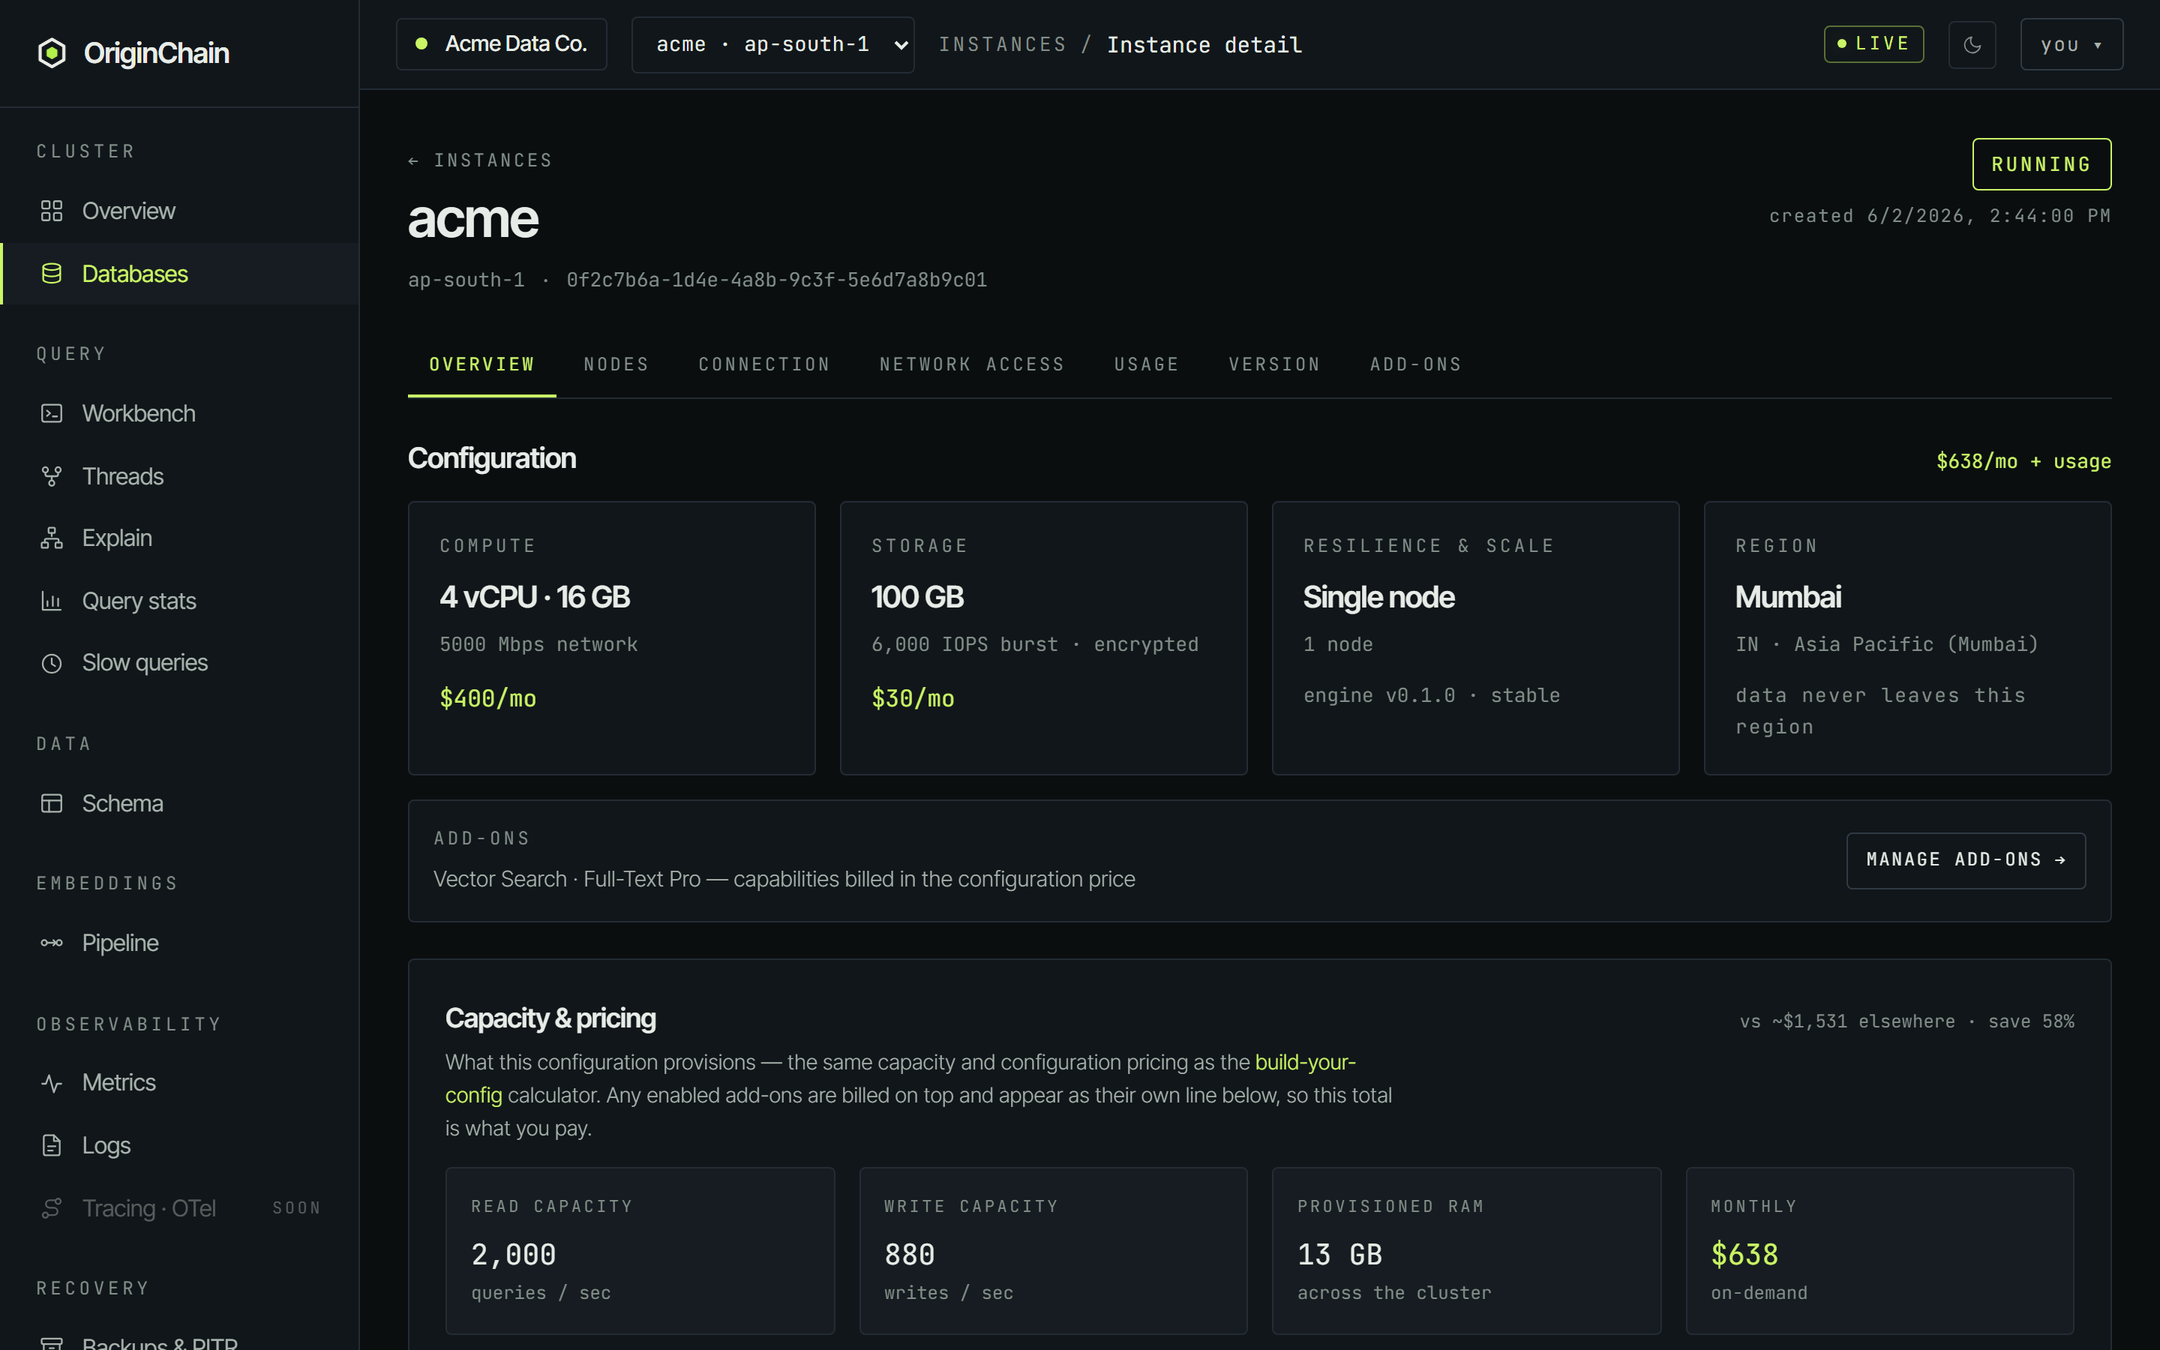
Capacity & pricing restates the build the way the pricing engine sees it - read capacity, write capacity, provisioned RAM, monthly total - with a line-by-line breakdown underneath. It is the same engine behind the public build-your-config calculator, so the number here and the number you were quoted at launch are the same number.
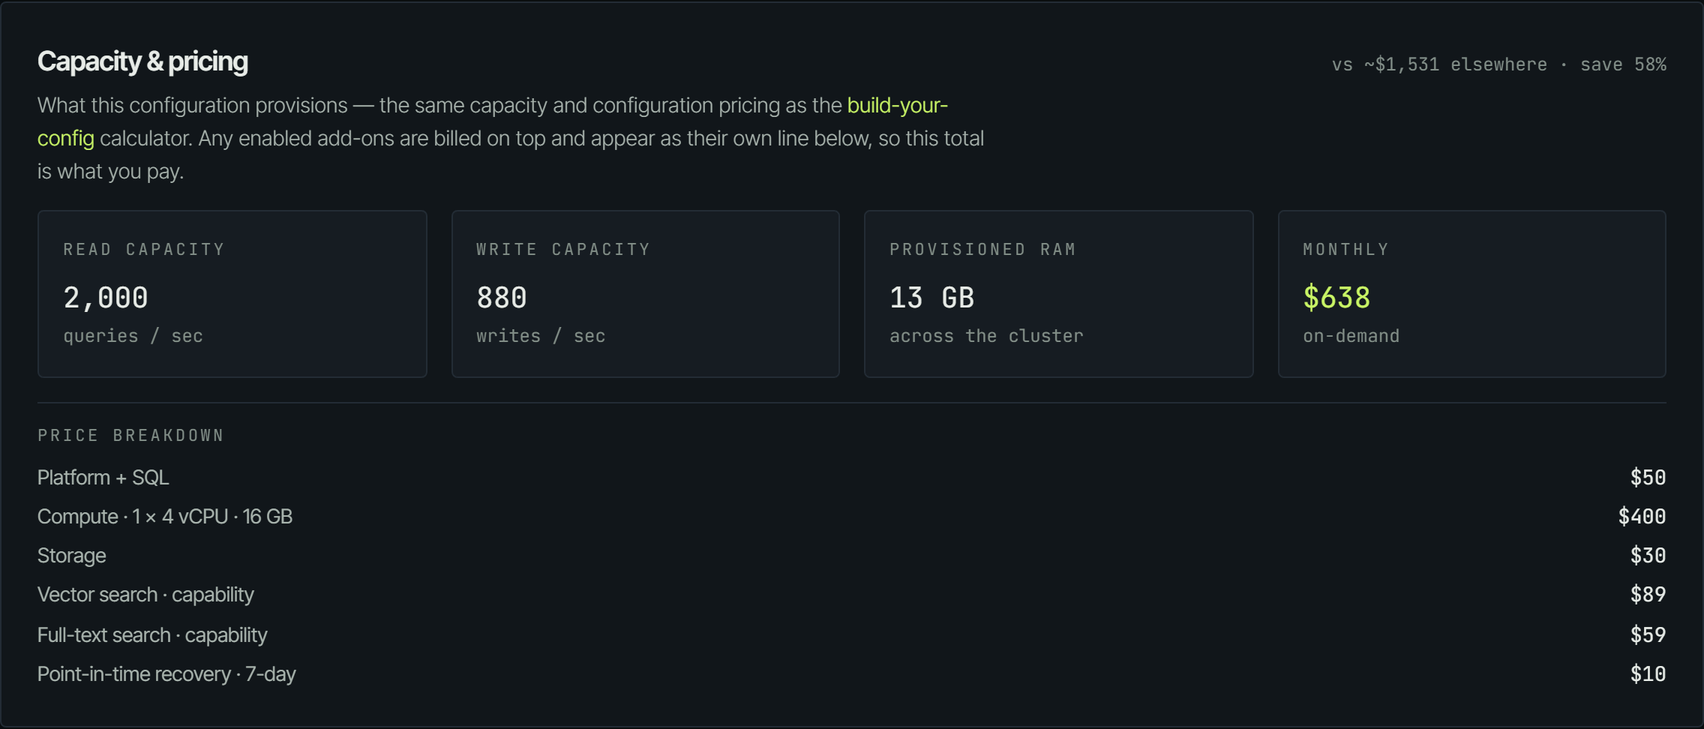
Below that, on a dedicated instance, Change configuration: compute resizes are self-serve (the engine restarts once, so expect a brief drop), storage grows online and can only increase, and node-count or high-availability changes are run for you as a coordinated migration. The Overview tab also carries the danger zone.
Nodes
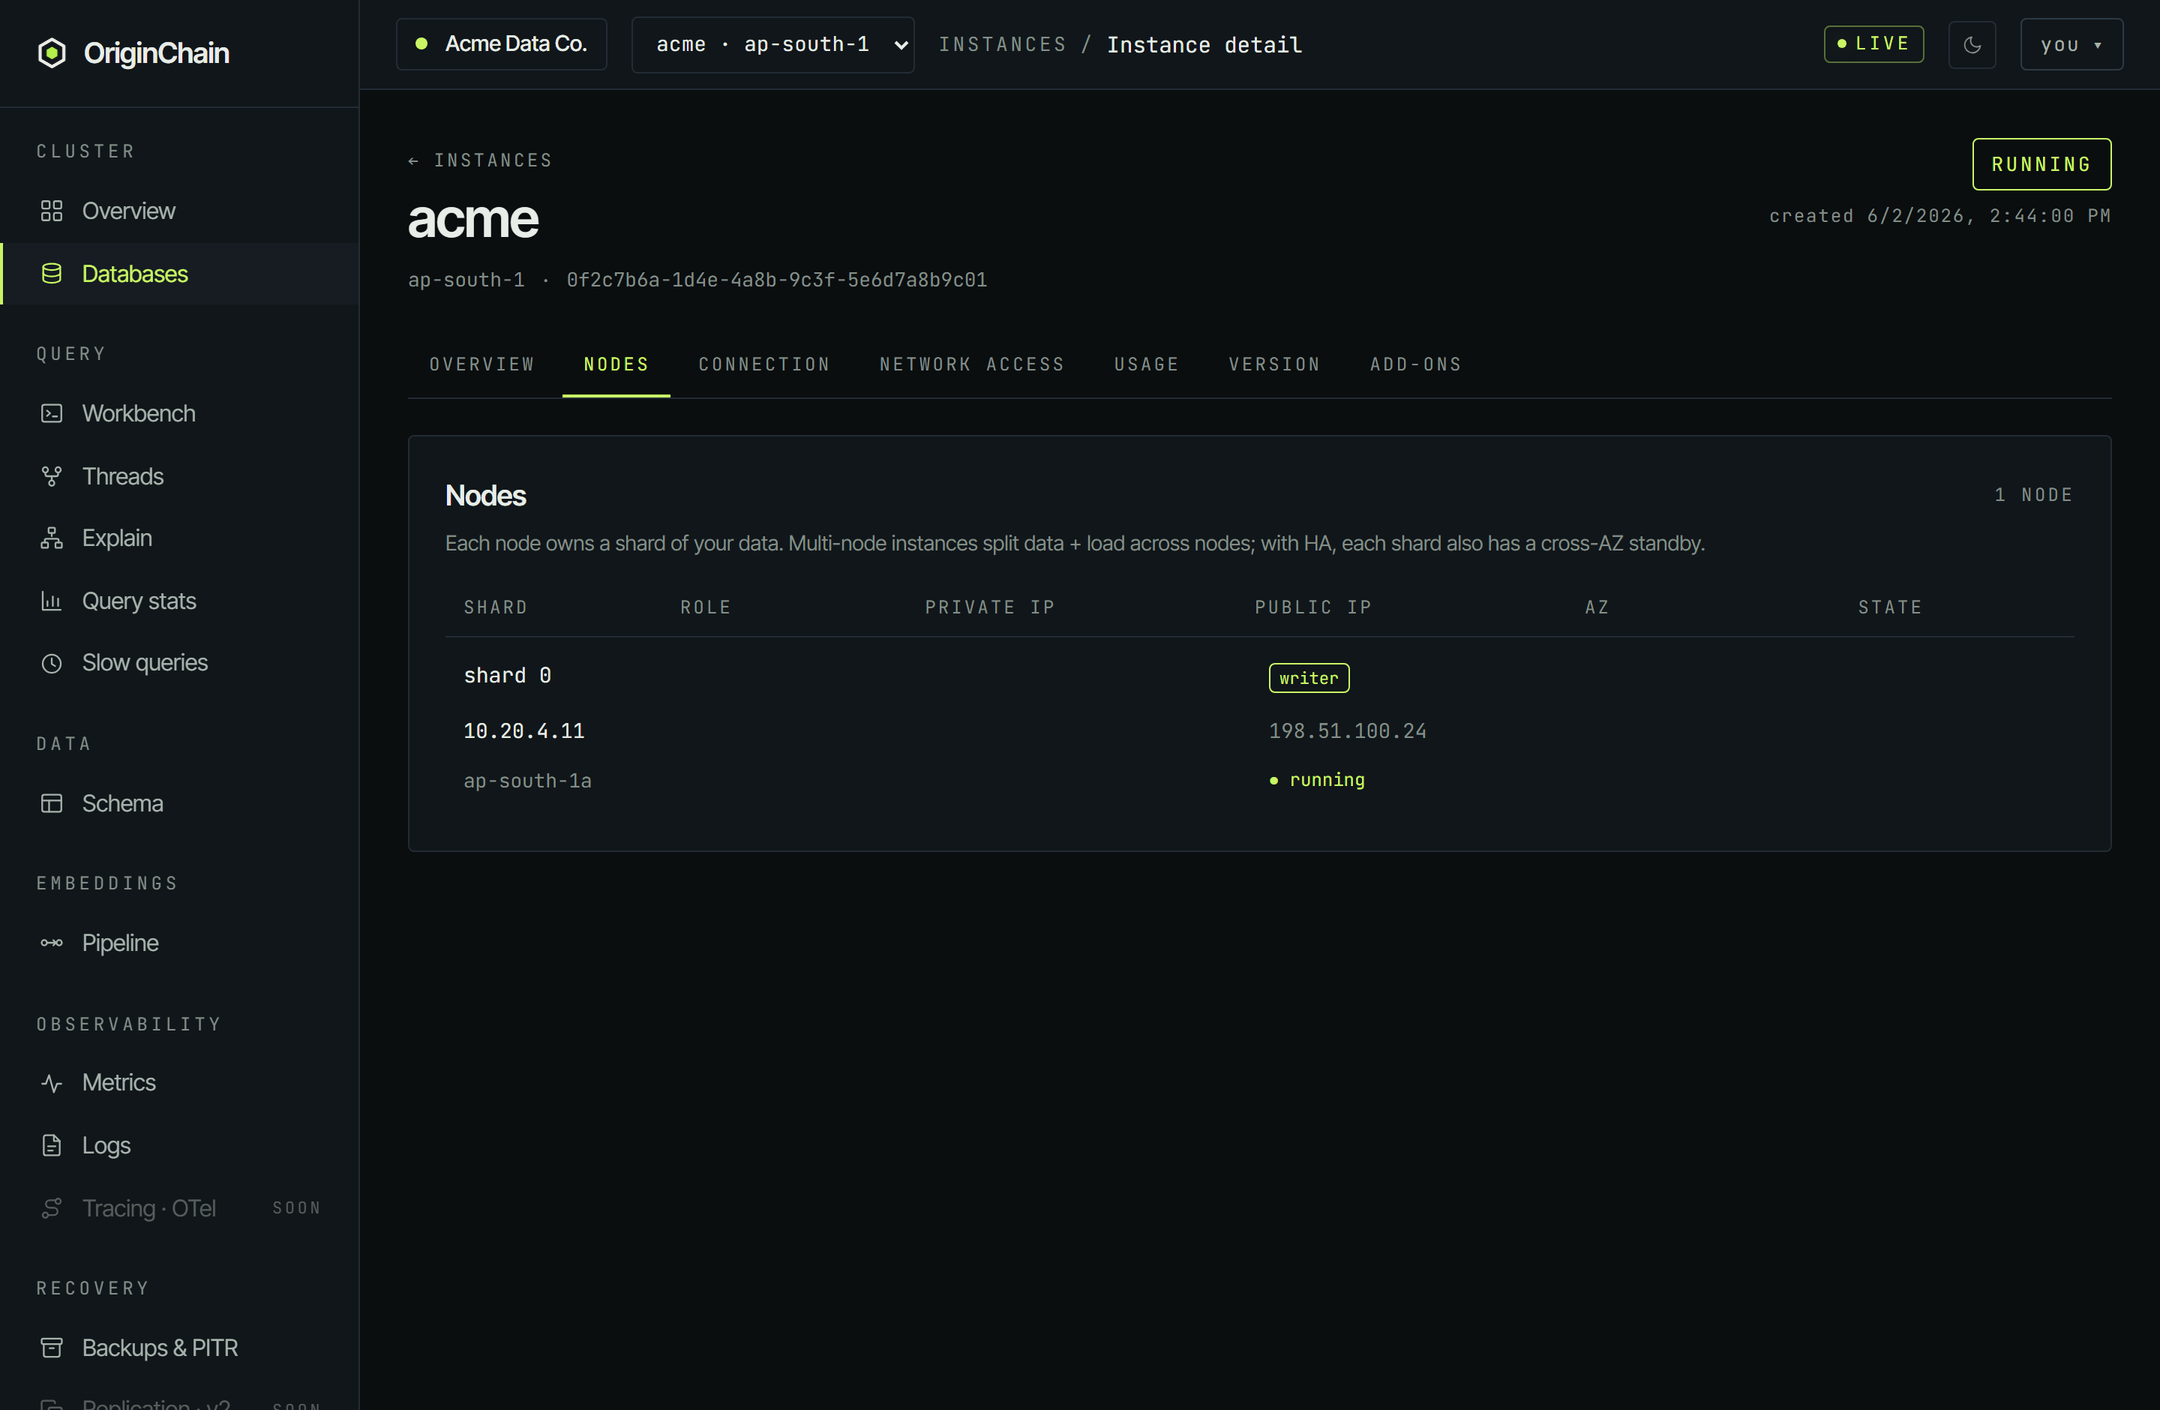
One row per node, with the shard it owns, its role (writer, or standby for a cross-zone replica), its private and public addresses, its availability zone, and its state. A single-node instance has exactly one row.
Connection
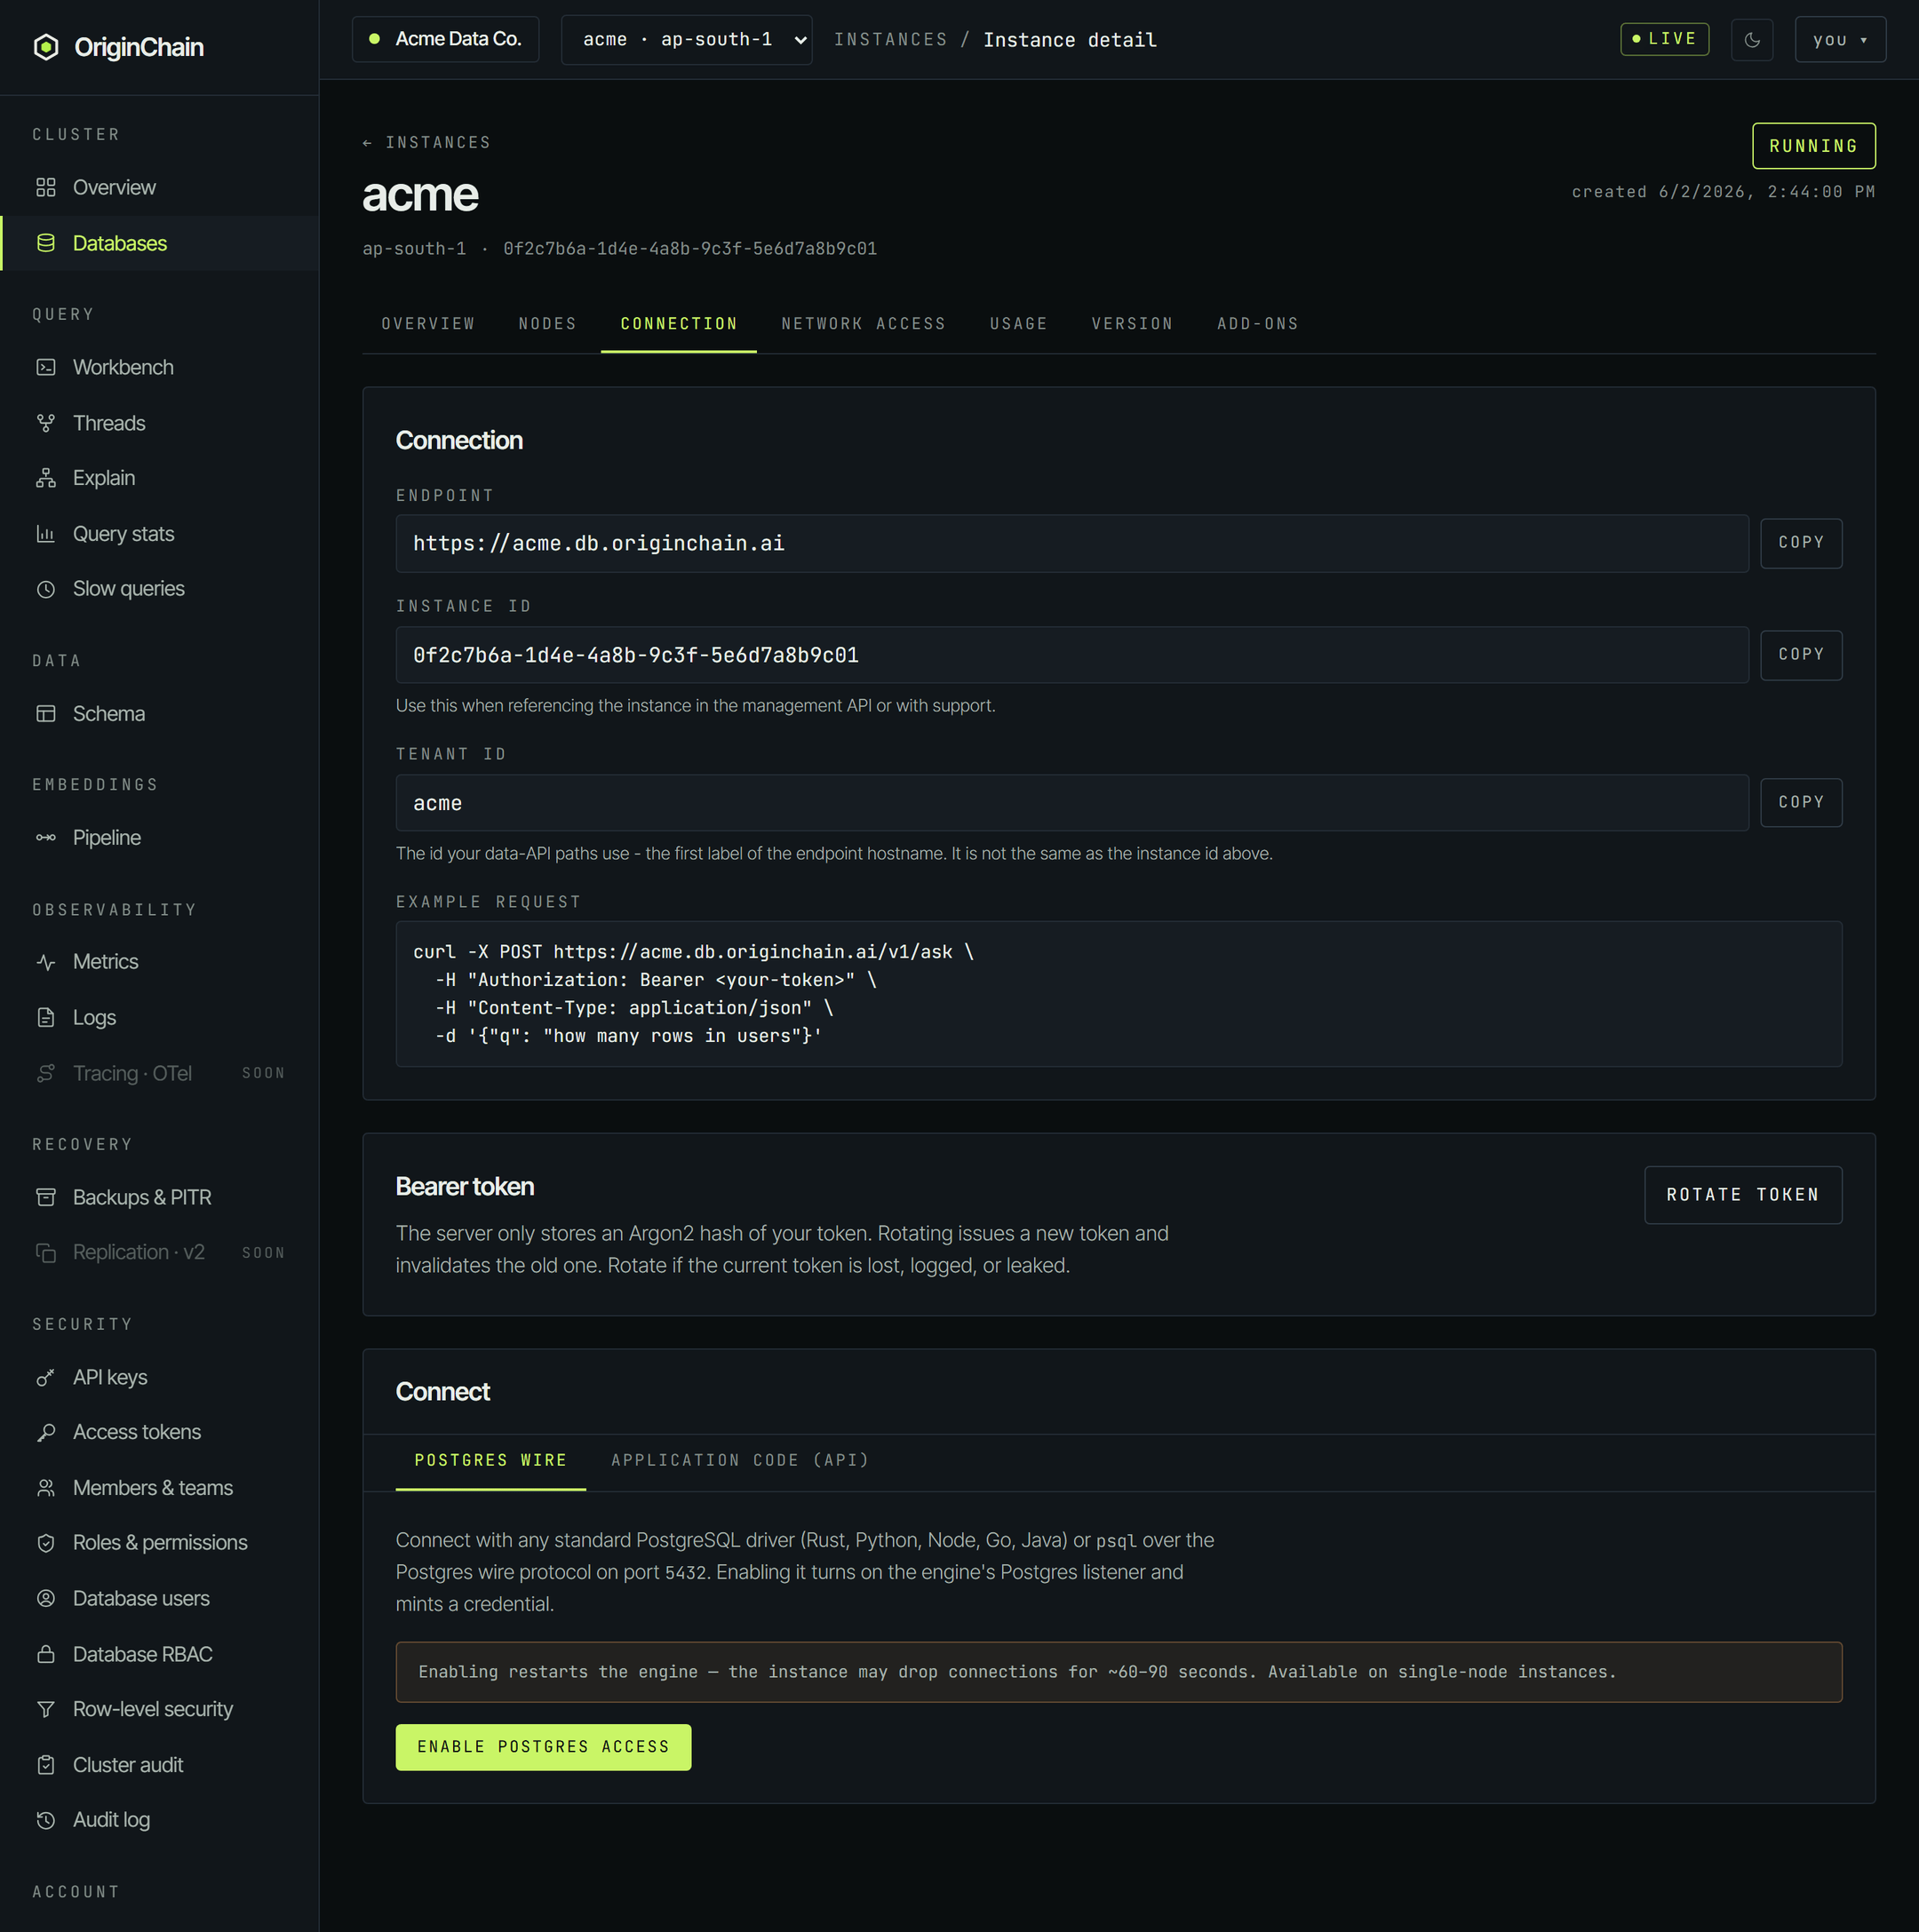
Everything a client needs, each with a copy button:
- Endpoint - the HTTPS base URL you send requests to.
- Instance ID - the UUID you quote in the management API or to support.
- Tenant ID - what your data-API paths use. It's the first label of the endpoint hostname, and it is not the instance id.
- Example request - a ready-made call against your own endpoint.
The example request carries a Bearer <your-token> placeholder, not your token. The token is shown once, at creation. If it's lost, Rotate token on this tab issues a new one and invalidates the old one - the server only stores a hash, so there is no way to reveal the original.
The Connect panel at the bottom has two halves: Postgres wire, which turns on a Postgres listener so any standard driver or psql can connect, and Application code (API), which gives you a paste-ready snippet in your language.
Network access
Controls which networks can reach the instance. The IP Access List gates both HTTPS and the Postgres wire: only listed addresses can connect, and an empty list allows any address. Entries are an IP or a CIDR range with an optional description; there are shortcuts for Add my current IP address and Allow access from anywhere. Changes apply within a few seconds, and node-to-node cluster traffic is never affected.
Dedicated instances also get Peering and Private Endpoint sub-tabs for requesting private connectivity. A free database only has the access list.
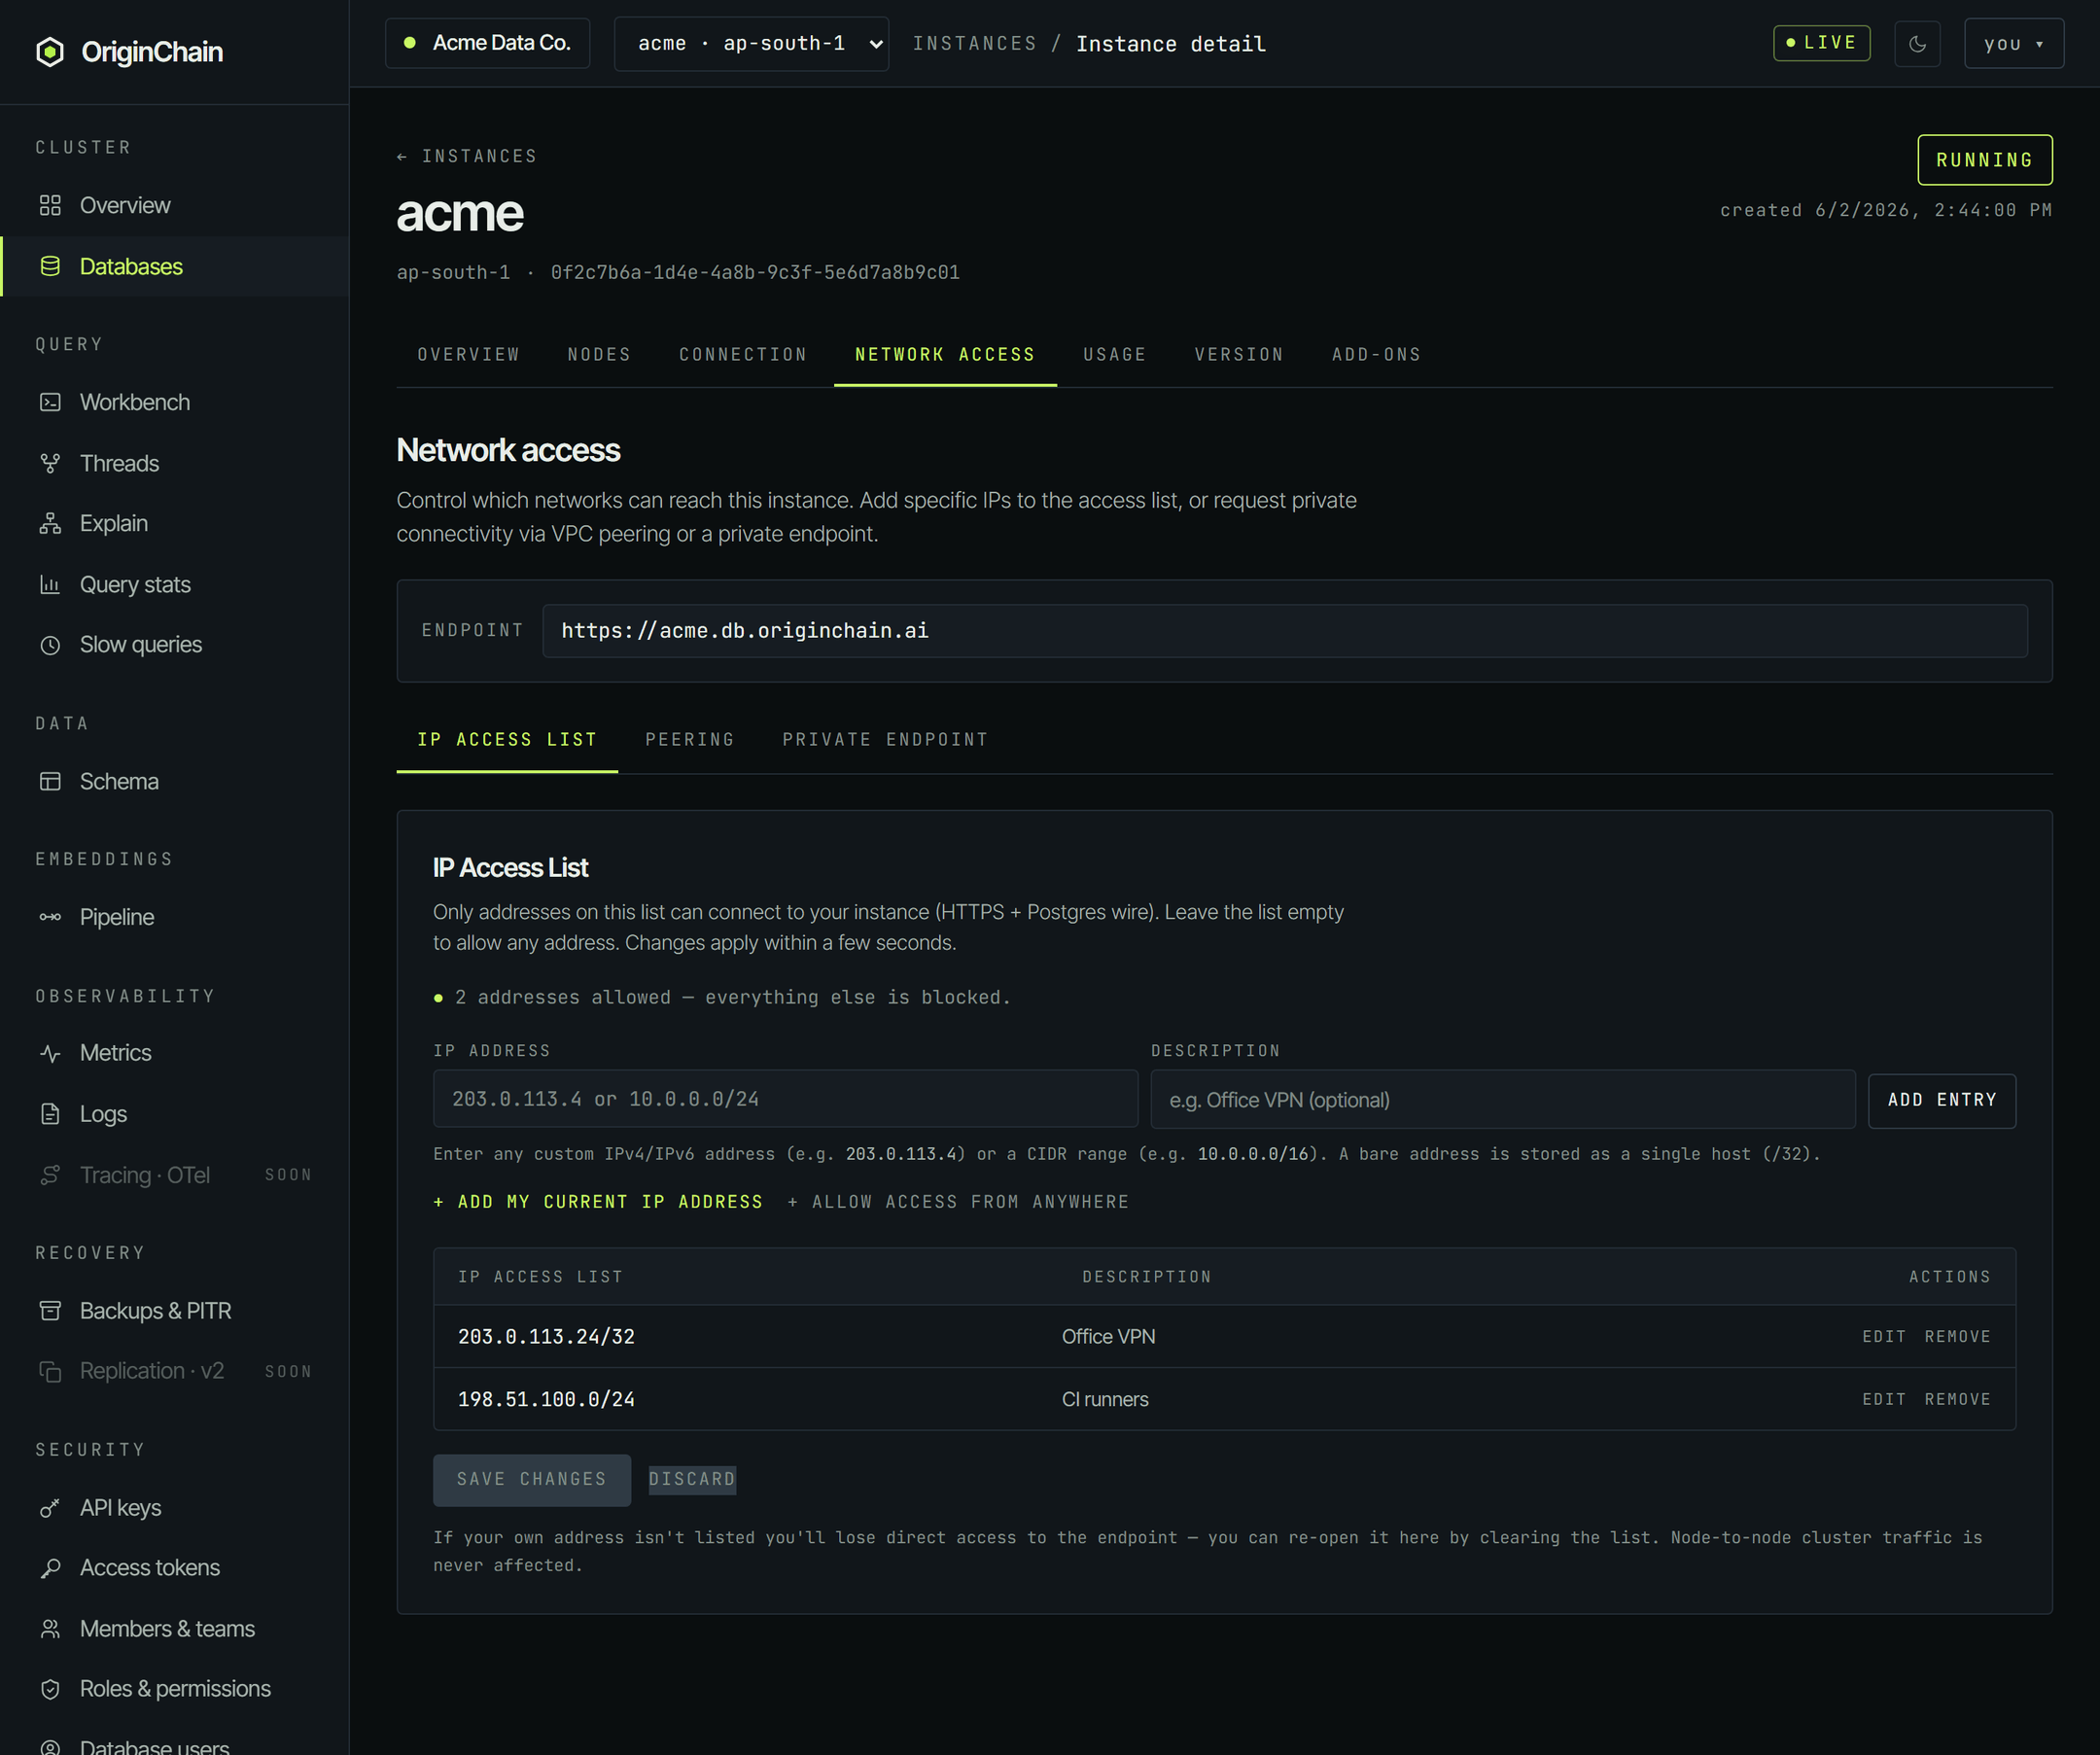
If your own address isn't on the list you lose direct access to the endpoint. You can always re-open it by clearing the list from here - the console says as much under the table.
Usage
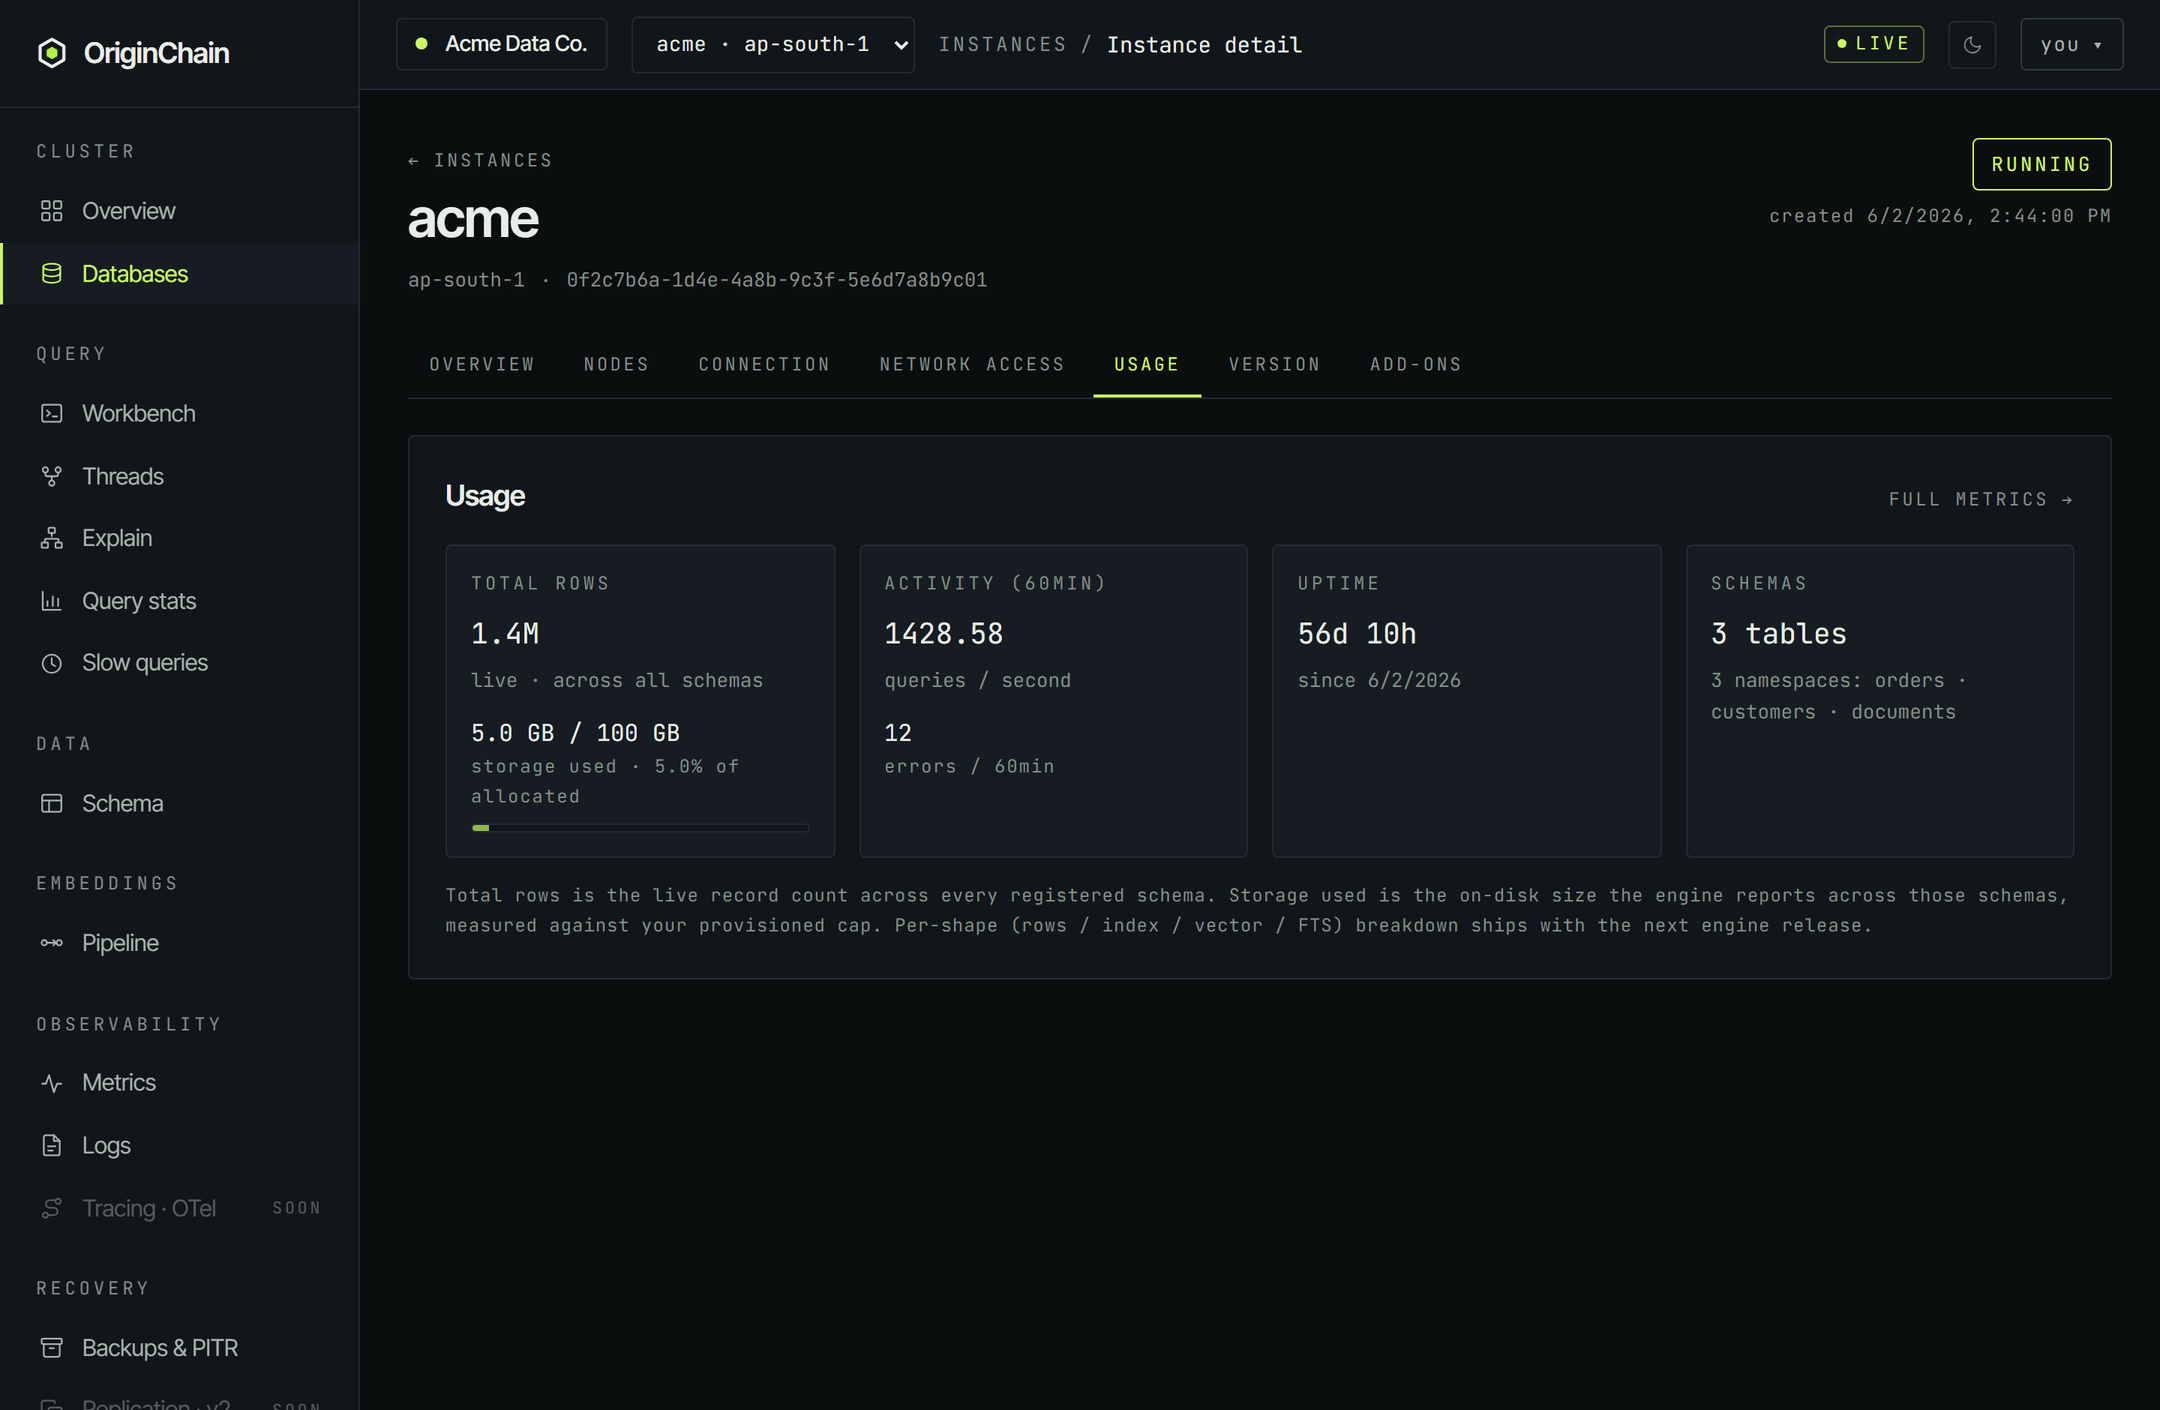
Four tiles: Total rows (the live record count across every registered schema, plus storage used against your provisioned cap), Activity over the last 60 minutes (queries per second and errors), Uptime, and Schemas. Full metrics → takes you to the Metrics page for the time-series view.
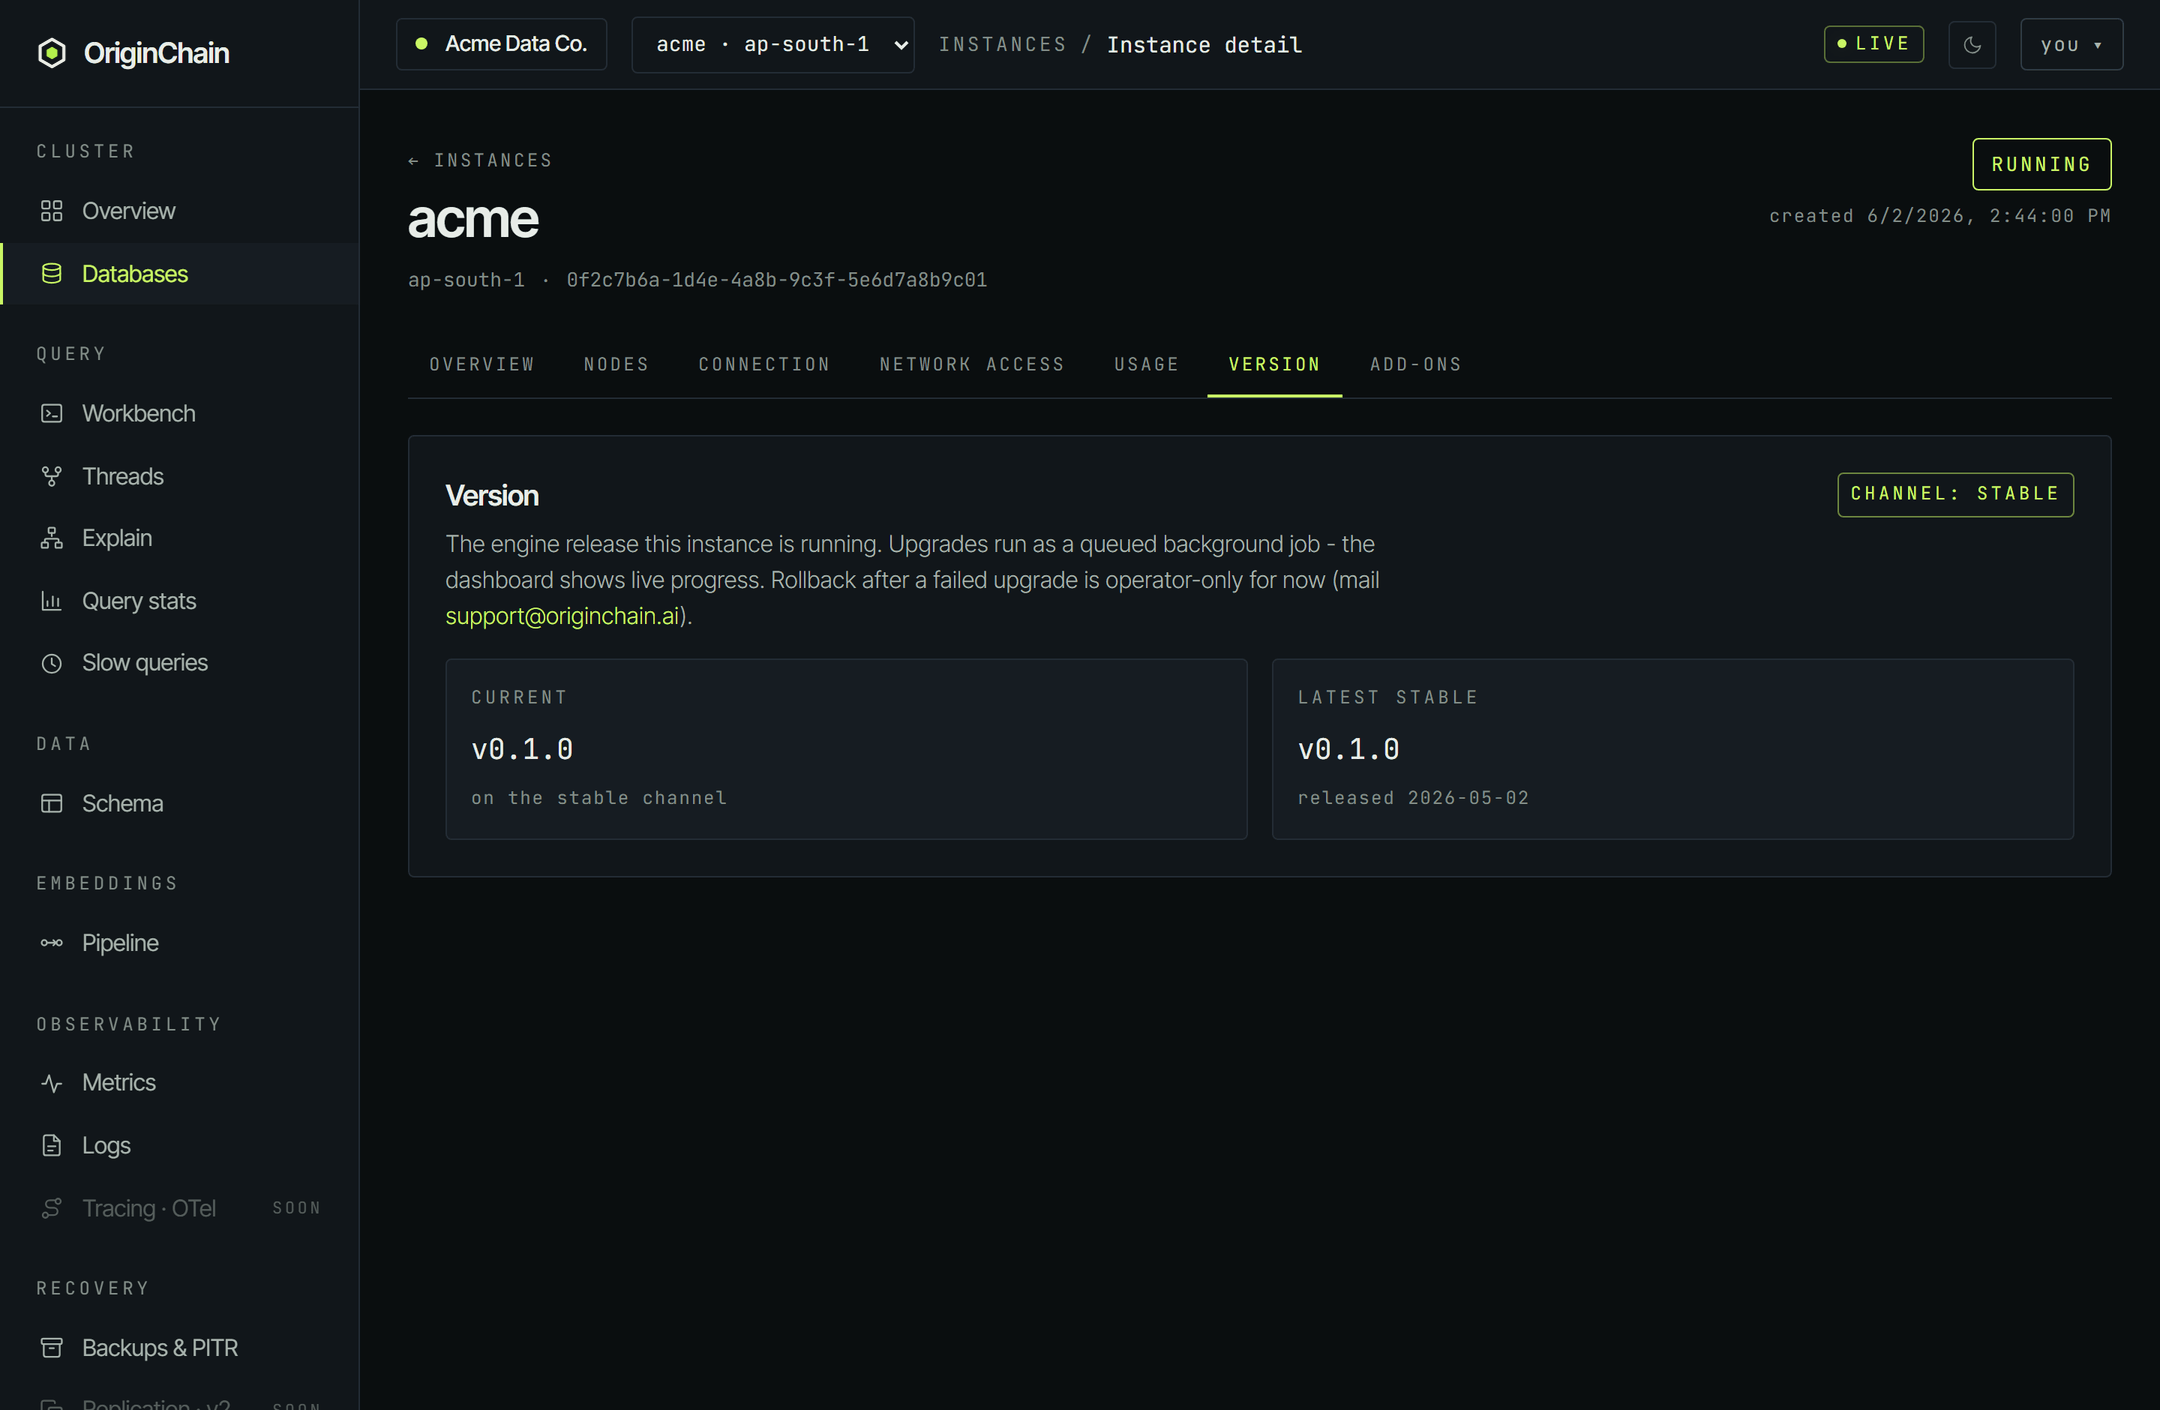
Version
The engine release this instance runs, its channel, and the latest stable release. When a newer one is available an Upgrade available panel appears with release notes and an Upgrade now button; a major-version jump requires ticking an acknowledgement first. Upgrades run as a queued background job with live progress. Rolling back after a failed upgrade is operator-only for now - mail support@originchain.ai.
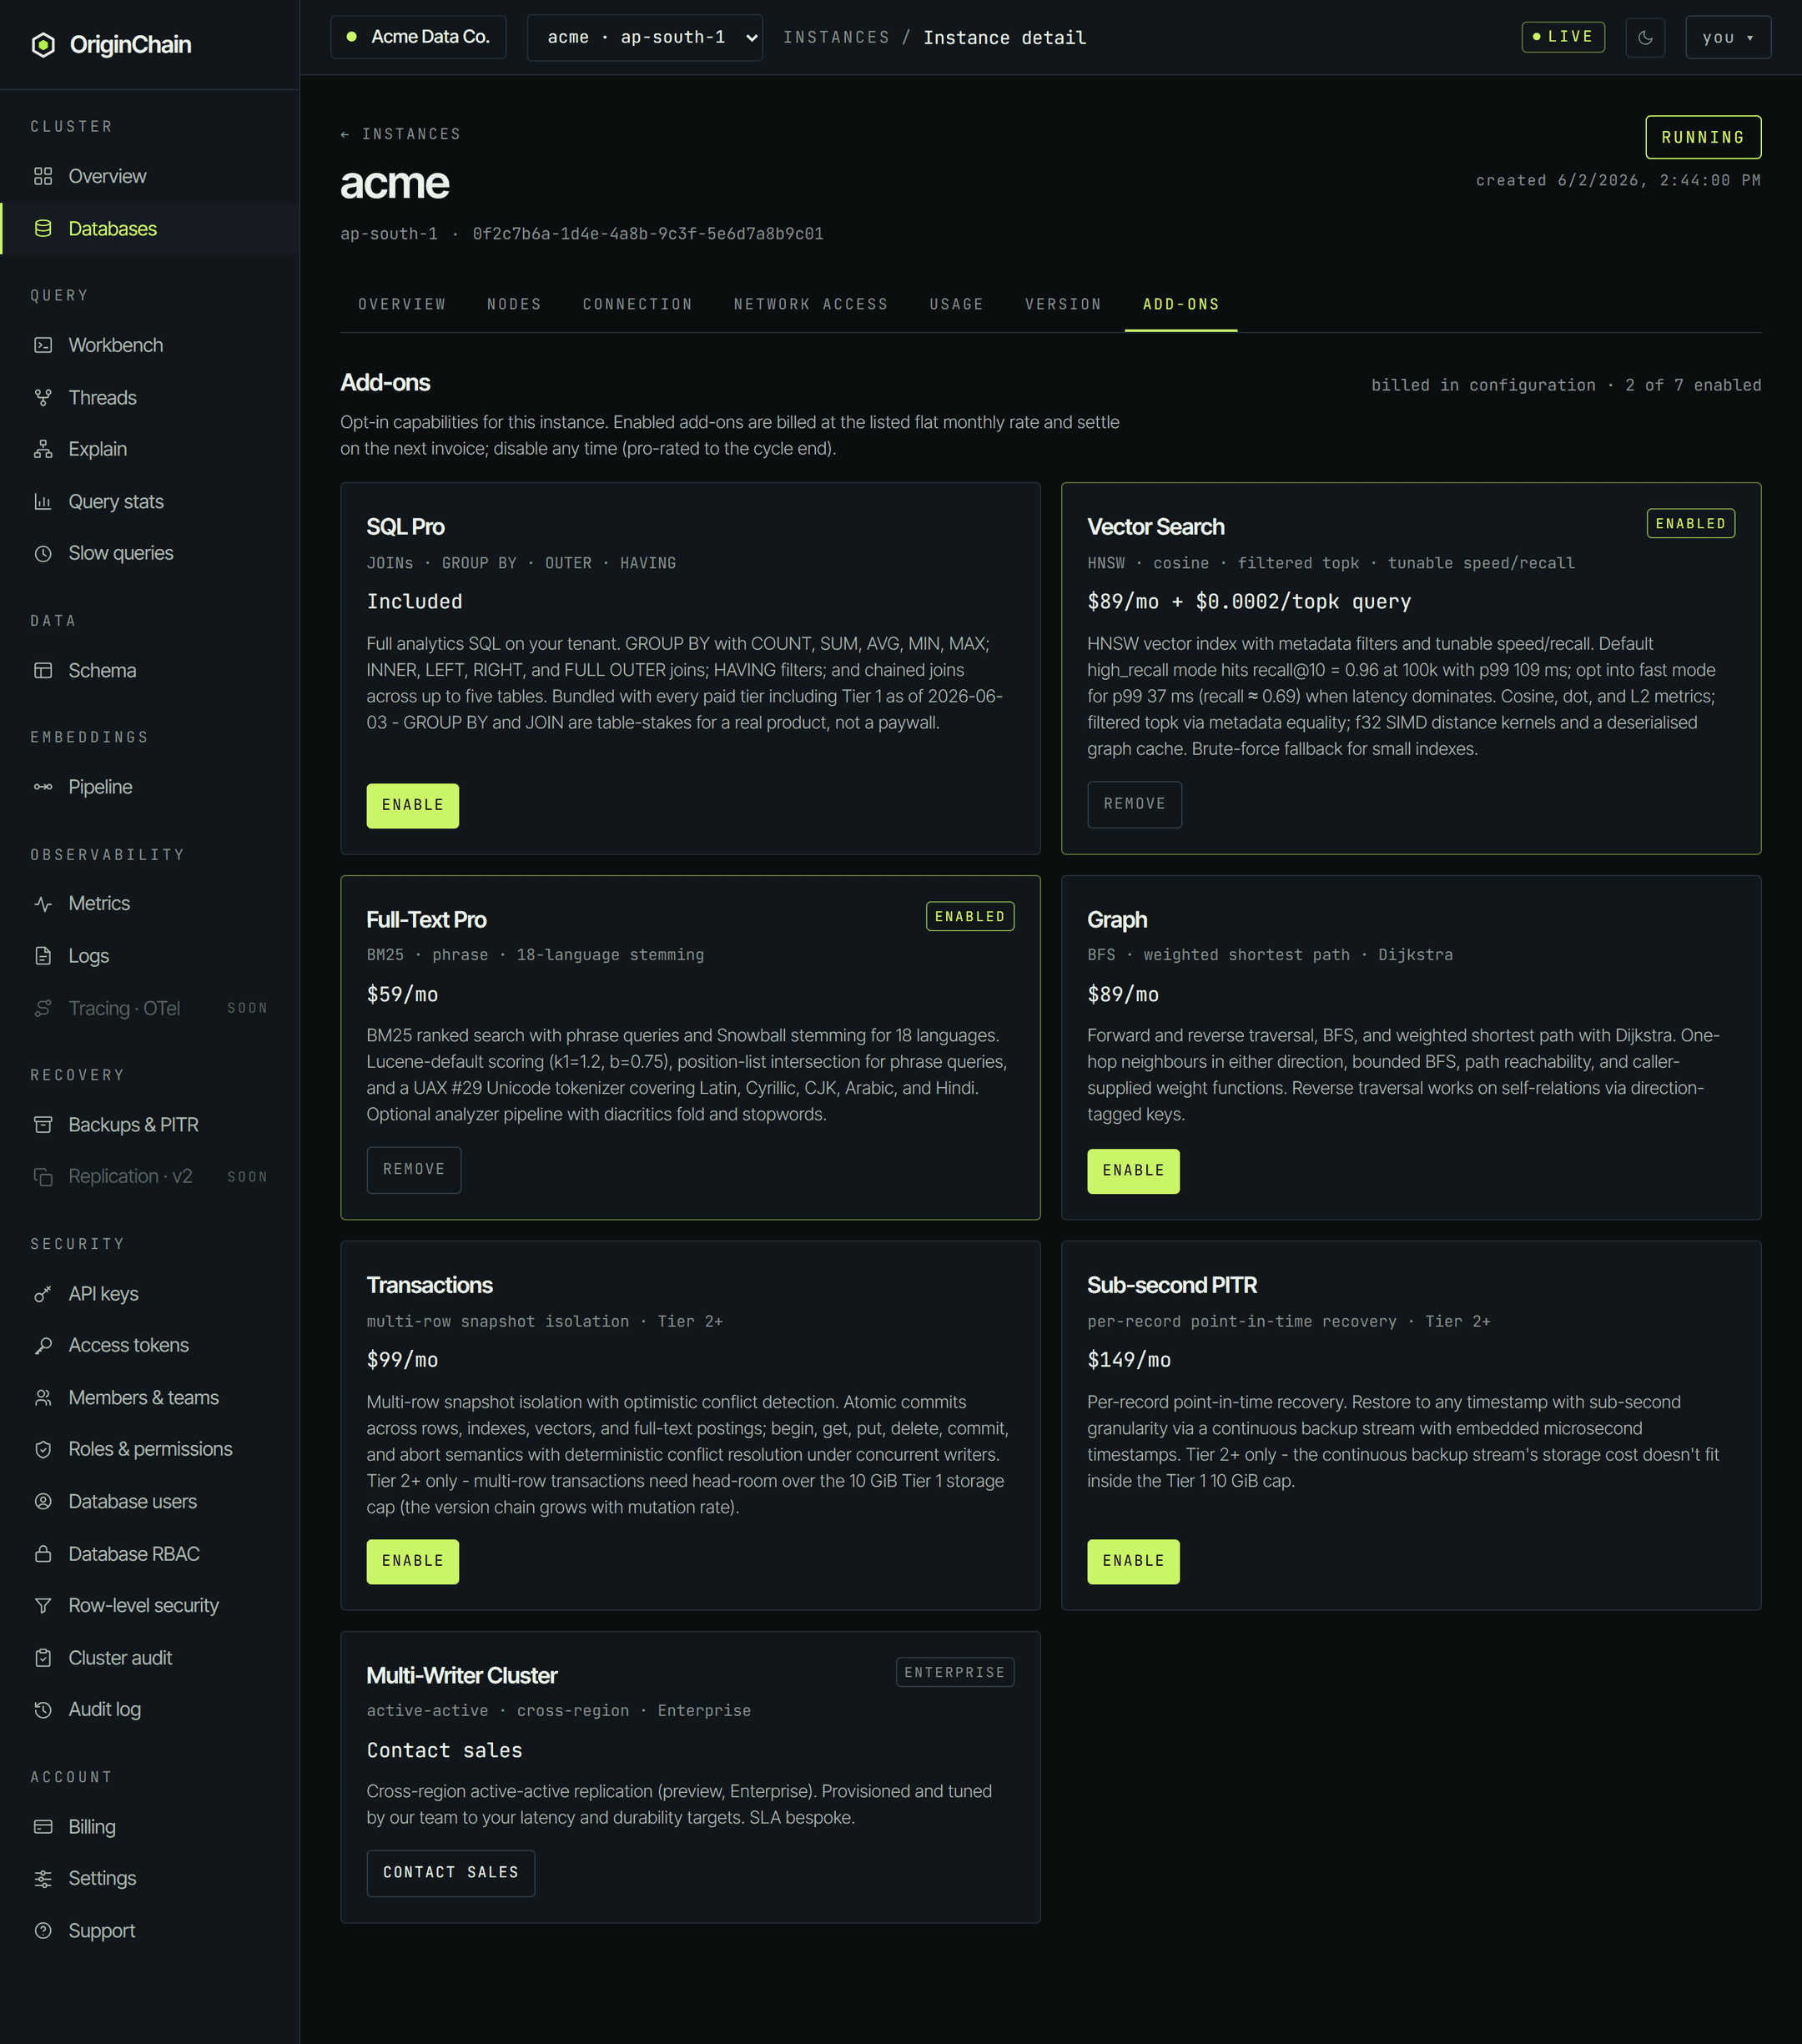
Add-ons
Opt-in capabilities for this instance, each a card with what it does, its flat monthly rate, and an enable or remove button. Enabled ones settle on your next invoice and can be disabled at any time, pro-rated to the end of the cycle. Capabilities you already sized in the launch configuration show as enabled and are marked billed in configuration - they are not charged twice.
The danger zone.
At the bottom of the Overview tab, in its own red-outlined panel, sits Delete instance. Deleting marks the instance for teardown. Data is unrecoverable once the grace window - 24 hours - has passed. It can't be undone.

The button opens a confirmation that makes you type the instance name before it will proceed - a mis-click can't delete anything. Once you go through with it the instance moves to DELETING and stays visible in the list while teardown runs, then becomes DELETED.
A deleting or deleted instance's detail page is read-only: a banner explains why and every control that would change something - delete, add-on toggles, Postgres access - is disabled.
Where to go next.
- Design a schema - register your first table from the console.
- Create an instance - if you need a second database.
- Quickstart - take the endpoint and token from the Connection tab and run a query.