
Run queries from the dashboard.
The Query workbench (Query → Workbench in the console sidebar) runs four kinds of query against the instance selected in the top bar. You pick one with the LANG switcher, type into the editor, and click RUN. There is no token to paste - the console talks to your instance for you.
Every example on this page runs against the shop.orders table from the quickstart, plus a shop.customers table that orders.customer points at.
SQL.
The default mode, and the one to reach for whenever you know the shape of the answer: filtering, sorting, counting, summing, and joining tables. Table names are fully qualified - namespace.table, so shop.orders, not orders.
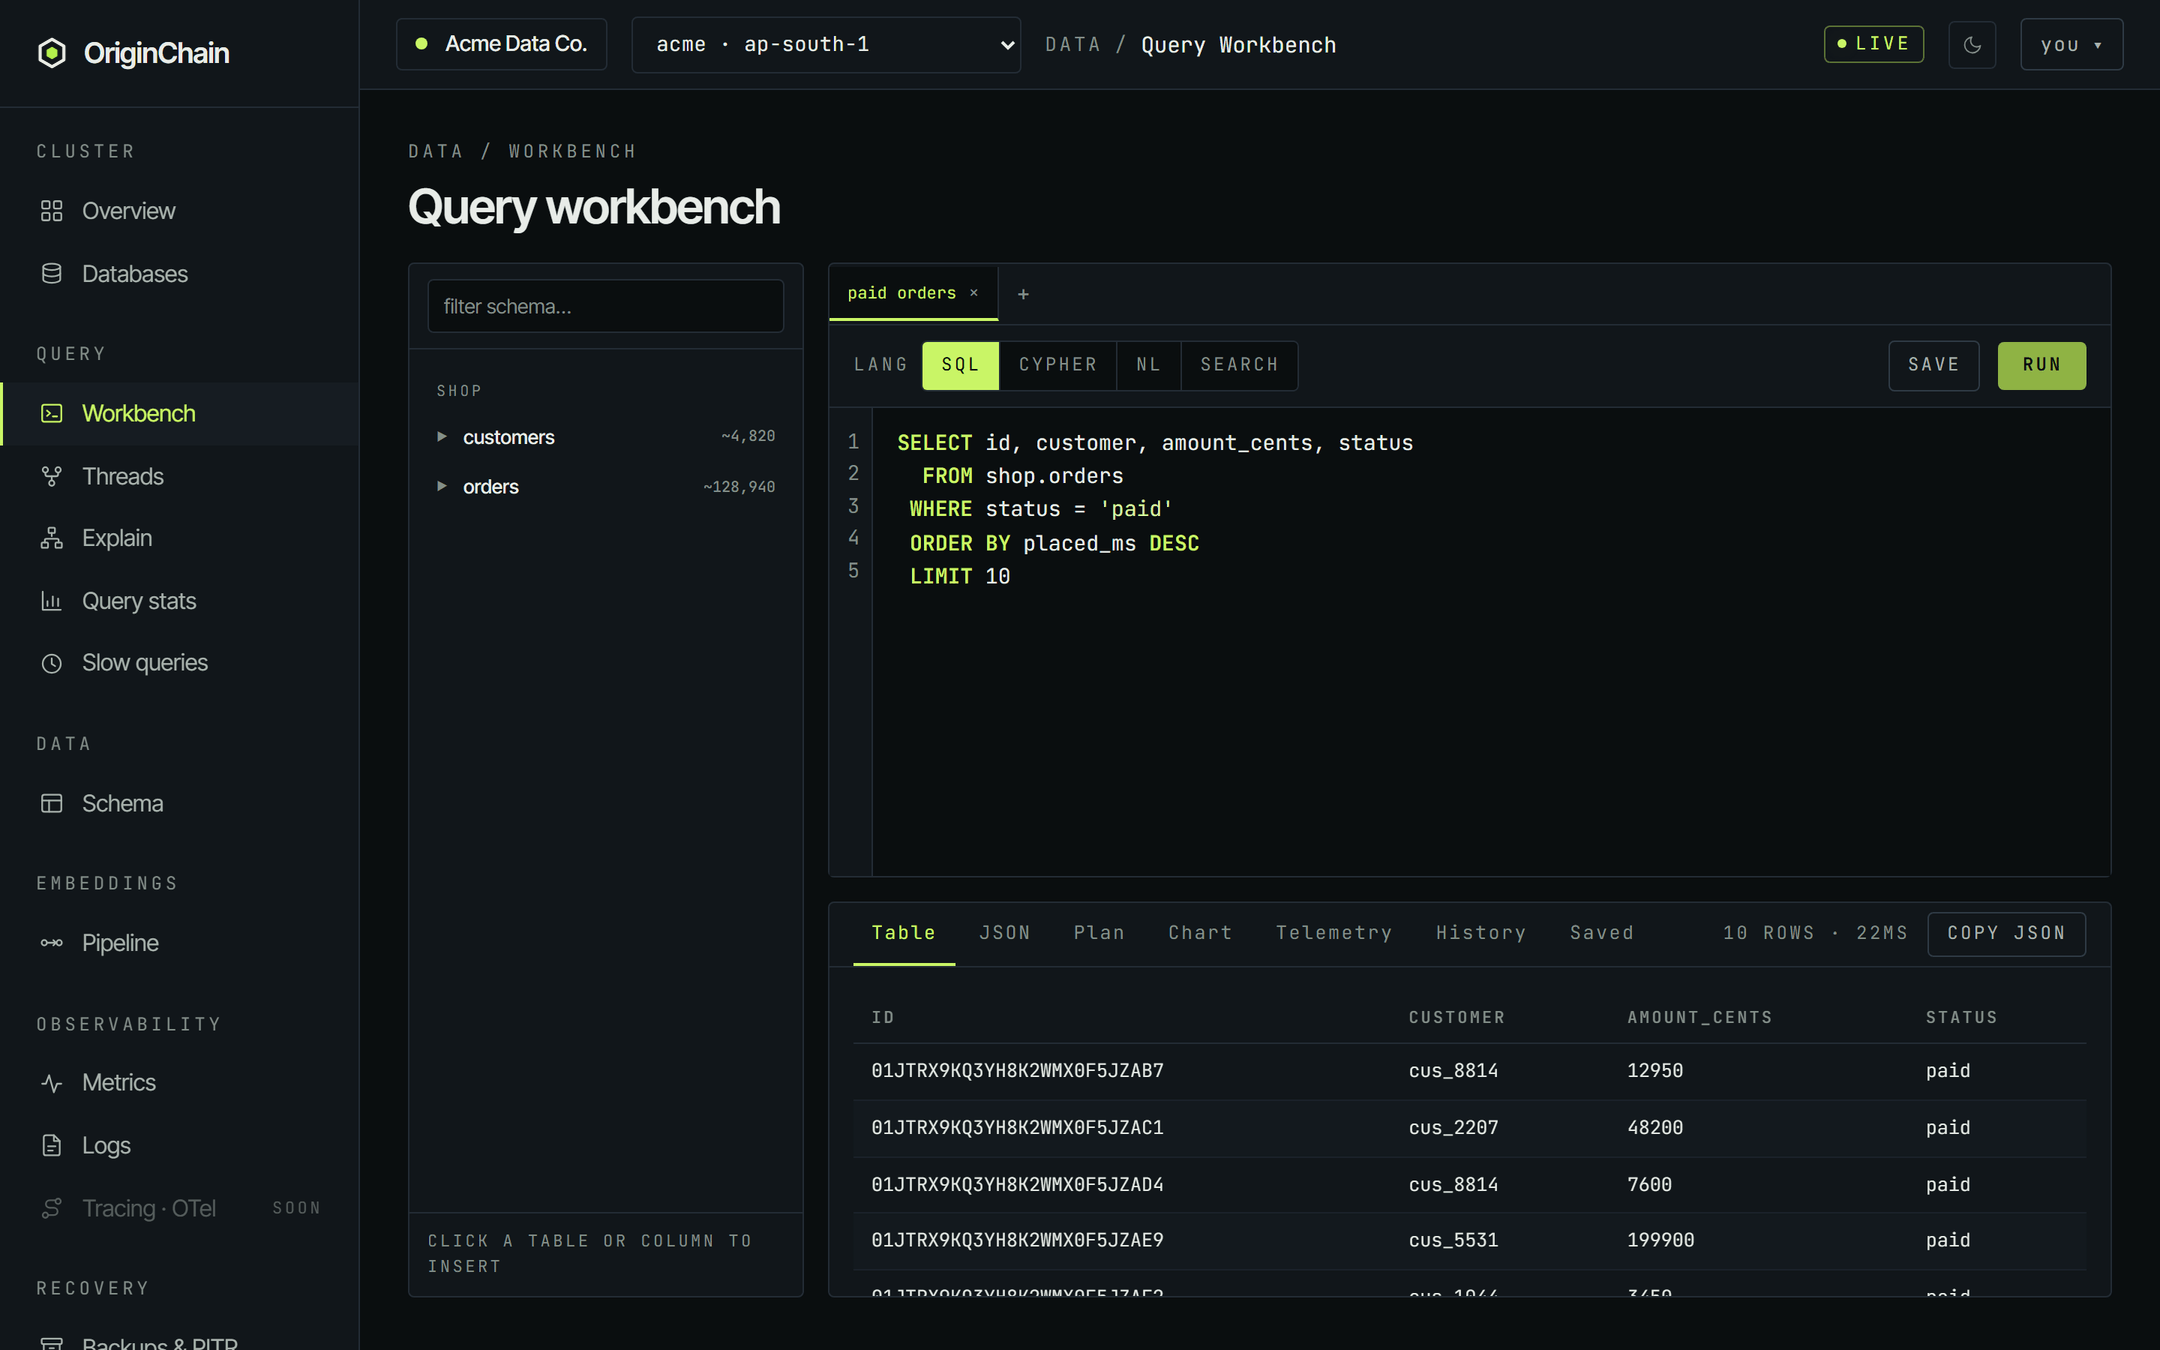
SELECT id, customer, amount_cents, status
  FROM shop.orders
 WHERE status = 'paid'
 ORDER BY placed_ms DESC
 LIMIT 10
Results land in the Table tab under the editor, one column per projected column, with the row count and elapsed time on the right of the tab strip.
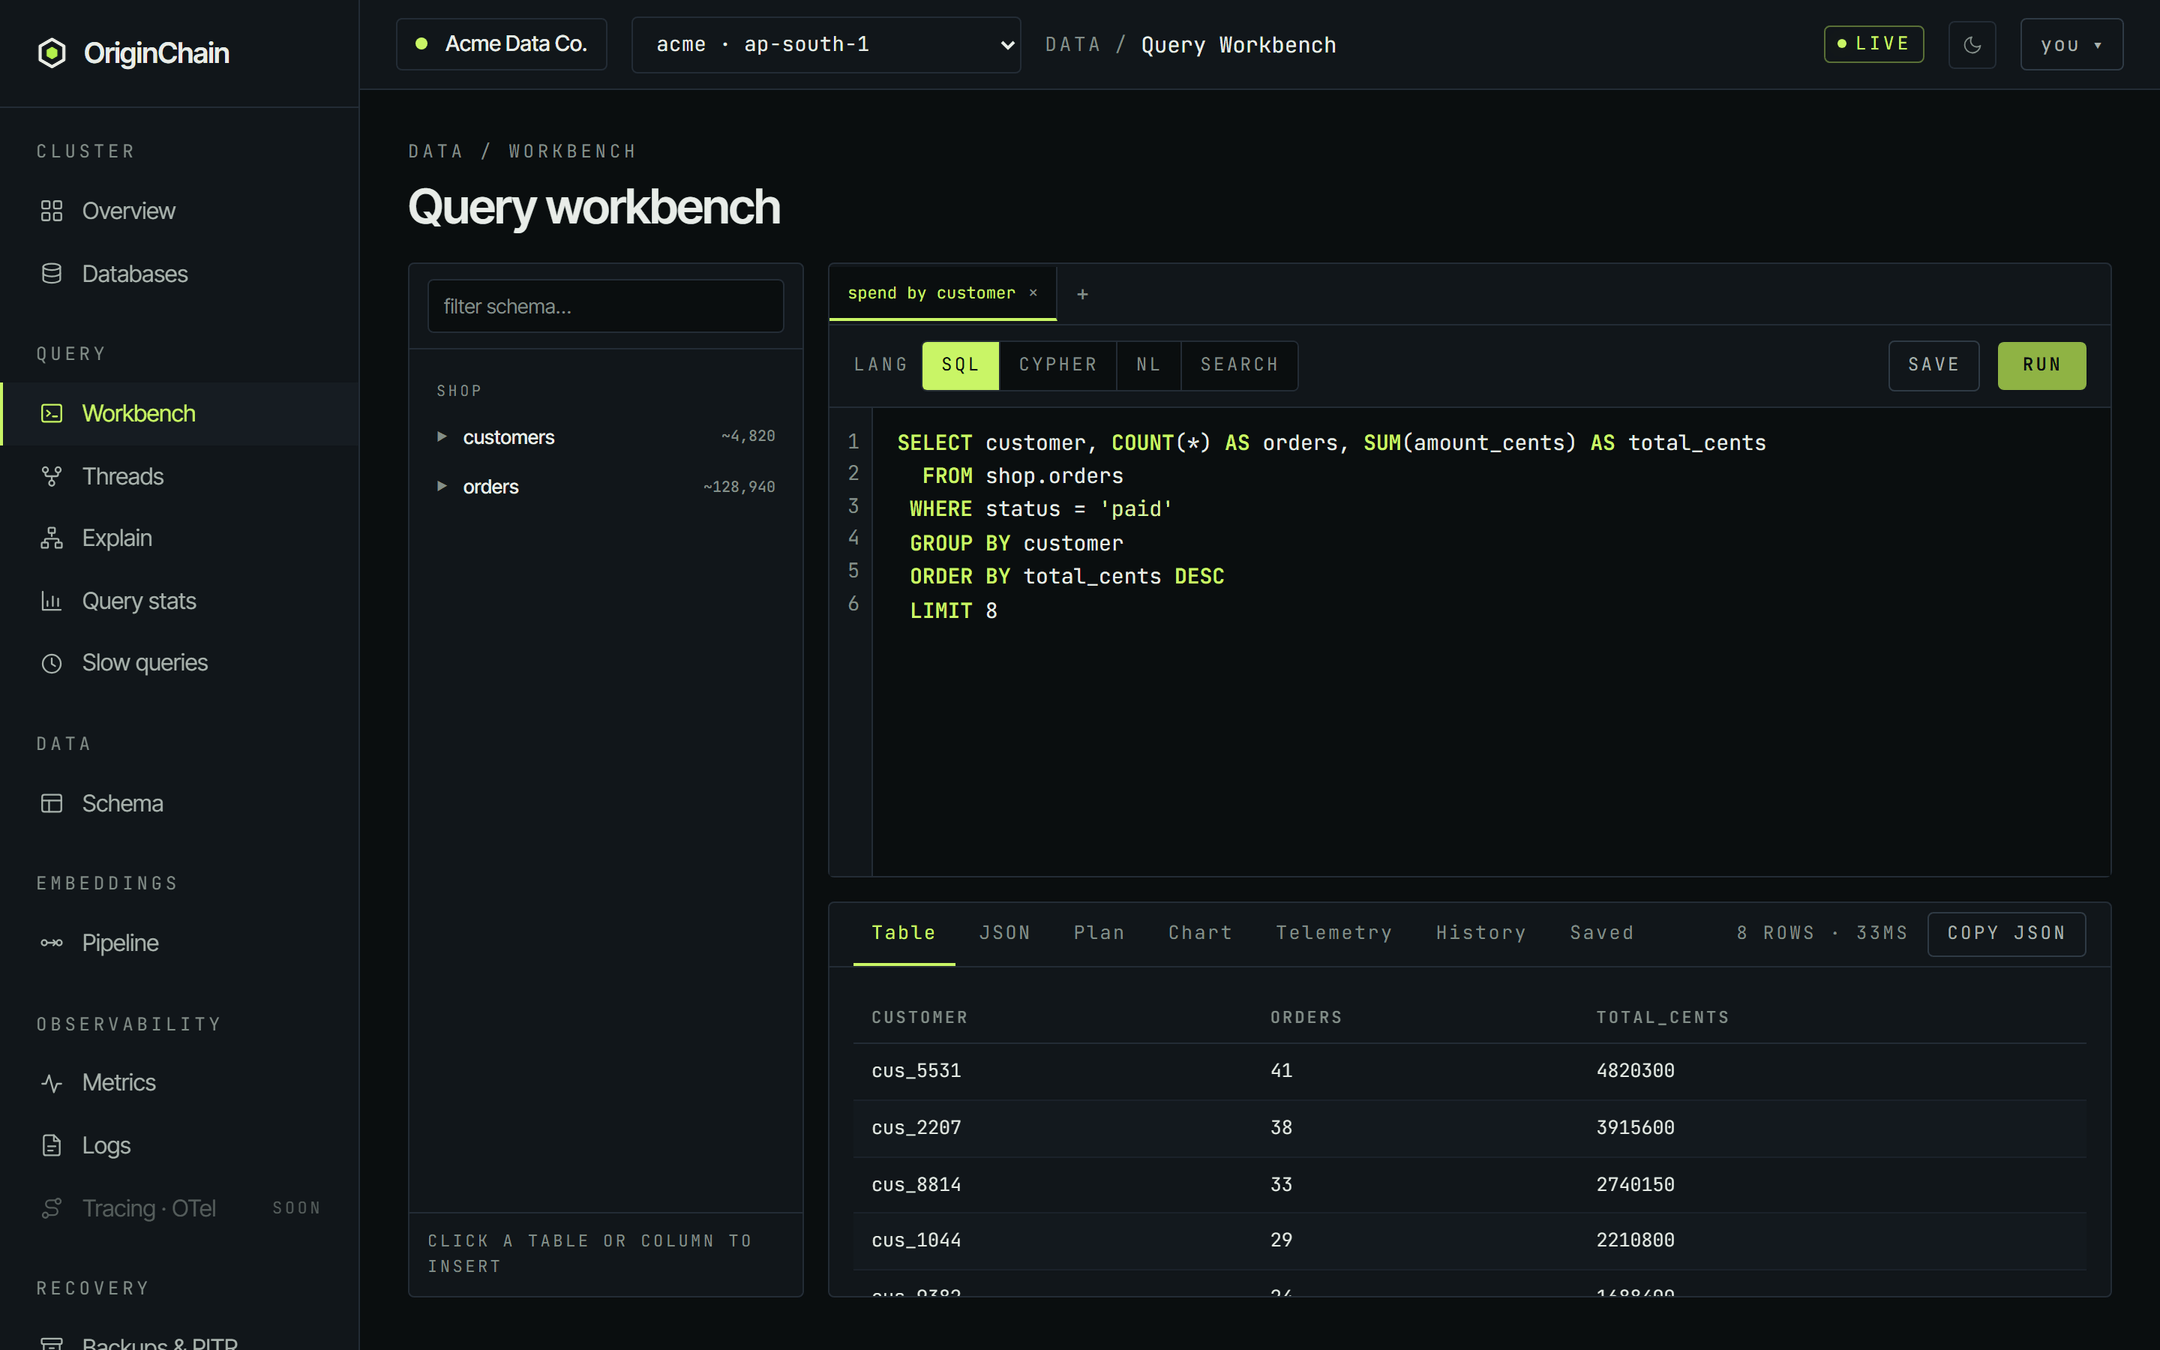
SELECT customer, COUNT(*) AS orders, SUM(amount_cents) AS total_cents
  FROM shop.orders
 WHERE status = 'paid'
 GROUP BY customer
 ORDER BY total_cents DESC
LIMIT 8 COUNT, SUM, AVG, MIN and MAX are the aggregate functions. Give each one an AS alias - that alias becomes the result column name, and it is what ORDER BY resolves against.
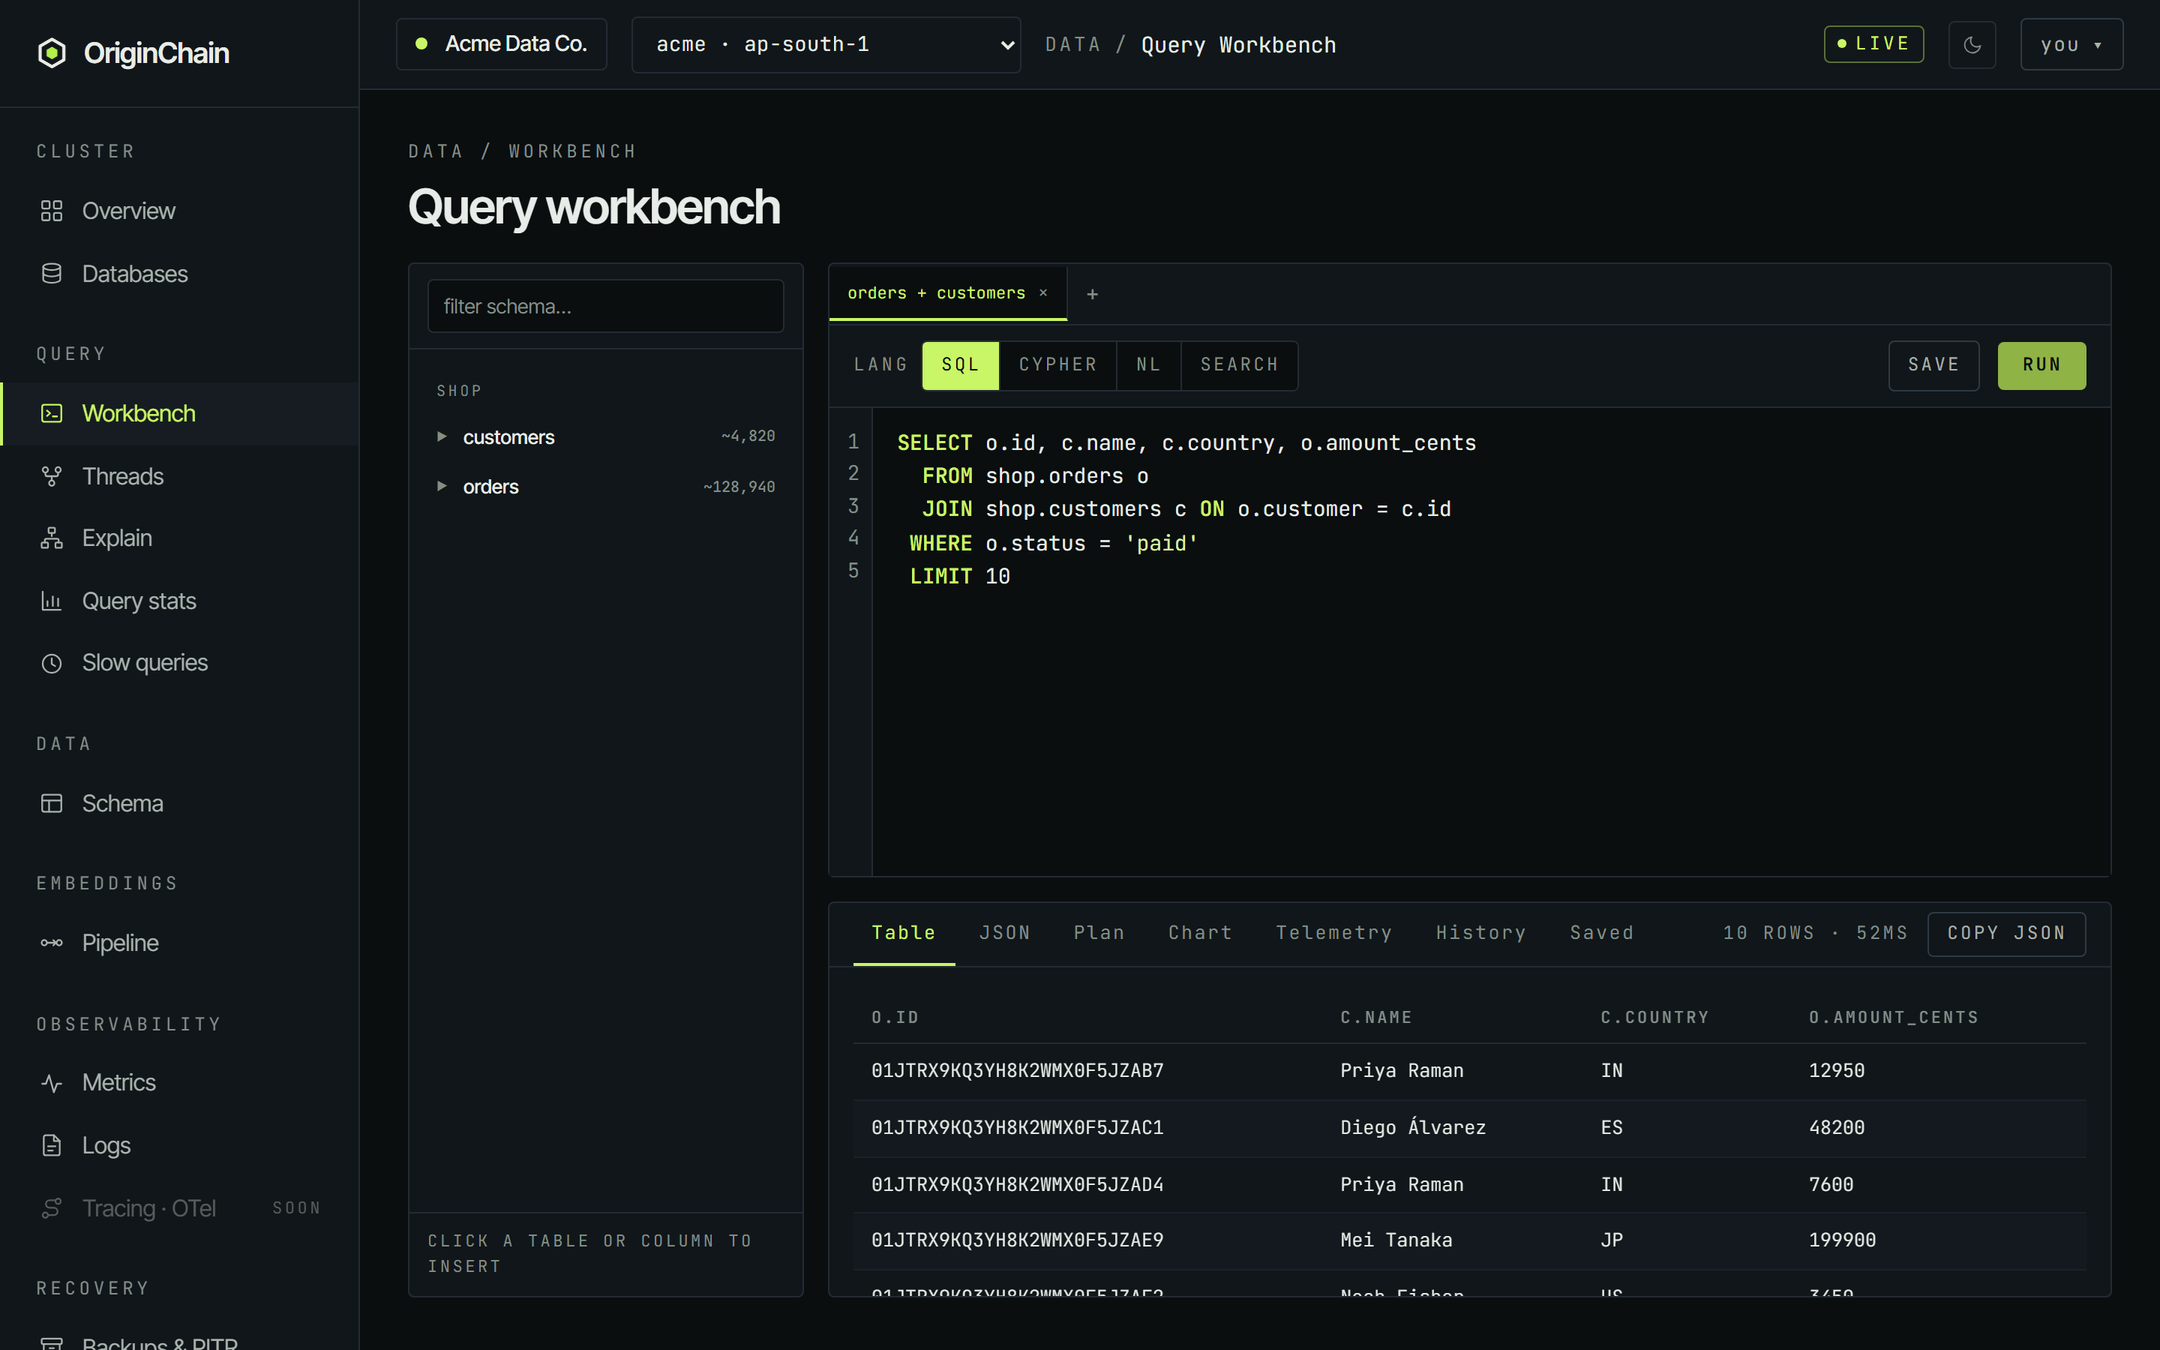
SELECT o.id, c.name, c.country, o.amount_cents
  FROM shop.orders o
  JOIN shop.customers c ON o.customer = c.id
 WHERE o.status = 'paid'
 LIMIT 10
INNER JOIN and the LEFT / RIGHT / FULL OUTER forms are supported. Two rules are worth knowing before you type:
- Each
ONclause is a single equality between two columns -ON o.customer = c.id. Comma joins (FROM a, b) are refused; write theJOIN … ONout. - Result columns come back alias-qualified: projecting
o.idgives you a column literally calledo.id.ASaliases are not accepted in a join projection, so rename in your client if you need different names.
Plain projections with WHERE, ORDER BY and LIMIT work on every instance. Queries that use GROUP BY, JOIN or HAVING require the SQL Pro add-on on that instance. If it is not enabled the run fails and the message is shown in place of the results table; enable it from Billing → Add-ons.
Cypher.
Use Cypher when the question is "what is this row connected to". A relation in OriginChain is a column on the row that points at another table's primary key - here shop.orders.customer points at shop.customers.id - so a hop across that column is a graph hop.
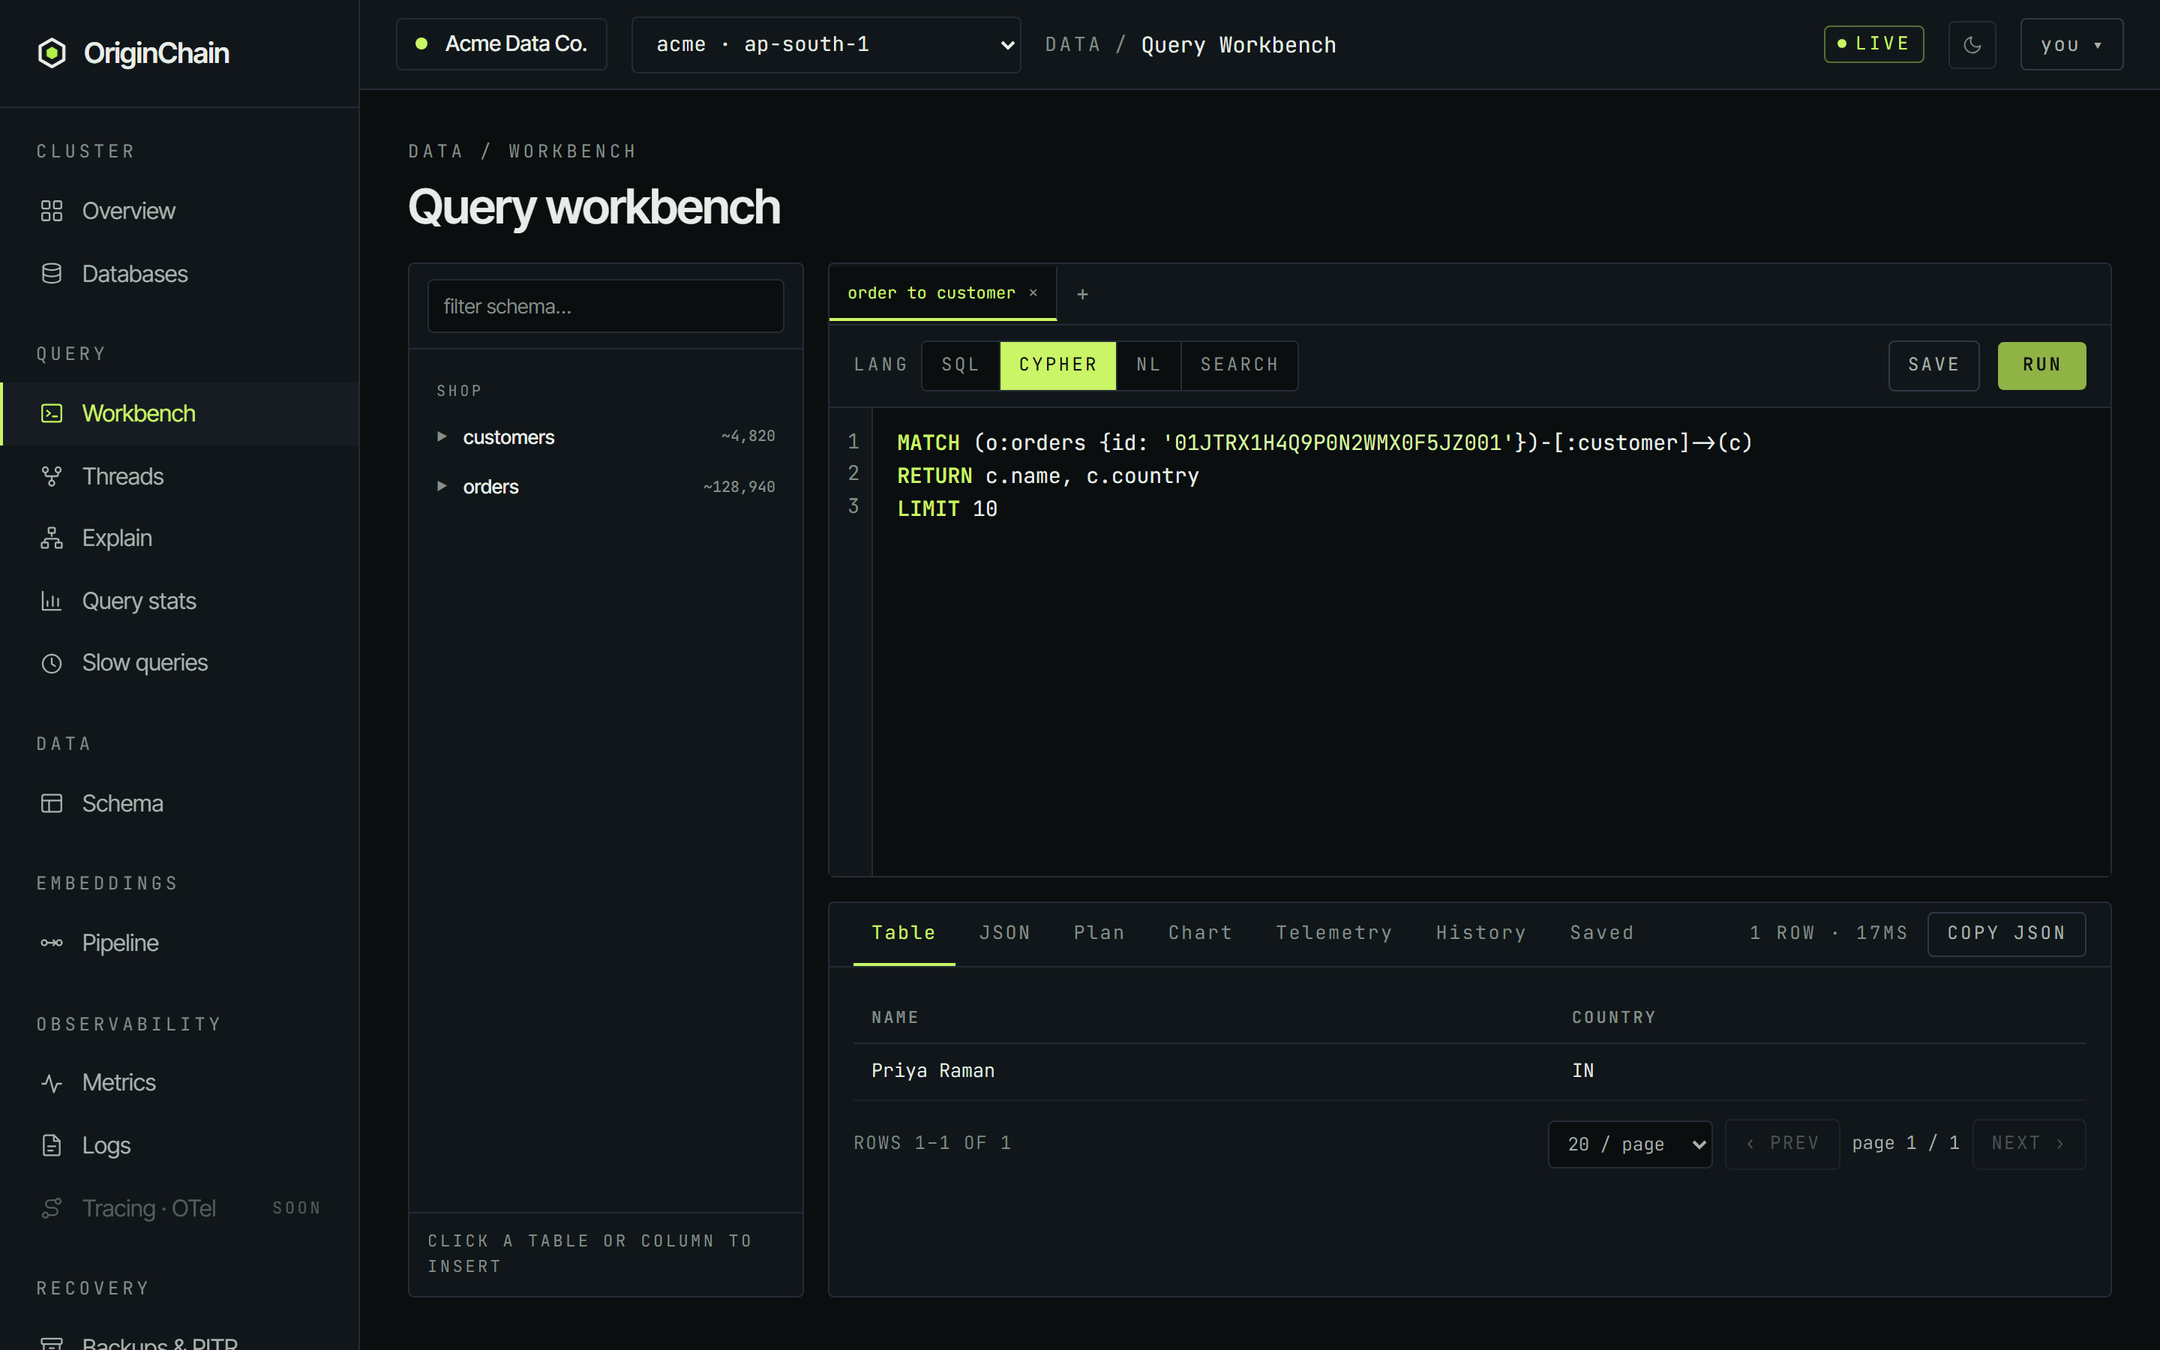
MATCH (o:orders {id: '01JTRX1H4Q9P0N2WMX0F5JZ001'})-[:customer]->(c)
RETURN c.name, c.country
LIMIT 10
The three parts that matter:
- Every node pattern needs a label. The workbench sends no default schema, so
(o:orders …)resolves the label against your registered tables. An unlabelled(o …)is refused. - The relation type is the column name -
-[:customer]->walksorders.customer. - Returned properties lose their variable prefix.
RETURN c.name, c.countrycomes back as columnsnameandcountry.
This is a deliberate subset, not all of Cypher. One MATCH pattern (optionally with chained hops, a variable-length path, or shortestPath), plus WHERE node.prop = literal, RETURN and LIMIT. Anything outside it - OPTIONAL MATCH, WITH, UNWIND, CALL, multiple MATCH clauses - is refused with a message telling you what to use instead, rather than silently returning something wrong.
NL - ask in plain English.
Switch LANG to NL and type a question instead of a query. There is no special syntax - one sentence, no punctuation rules:
which countries spent the most on paid ordersThe question is compiled against the schemas registered on that instance and the answer comes back as rows, rendered in the same Table tab as everything else. NL runs are slower than the equivalent SQL - the first ask of a given question has to compile before it can execute.
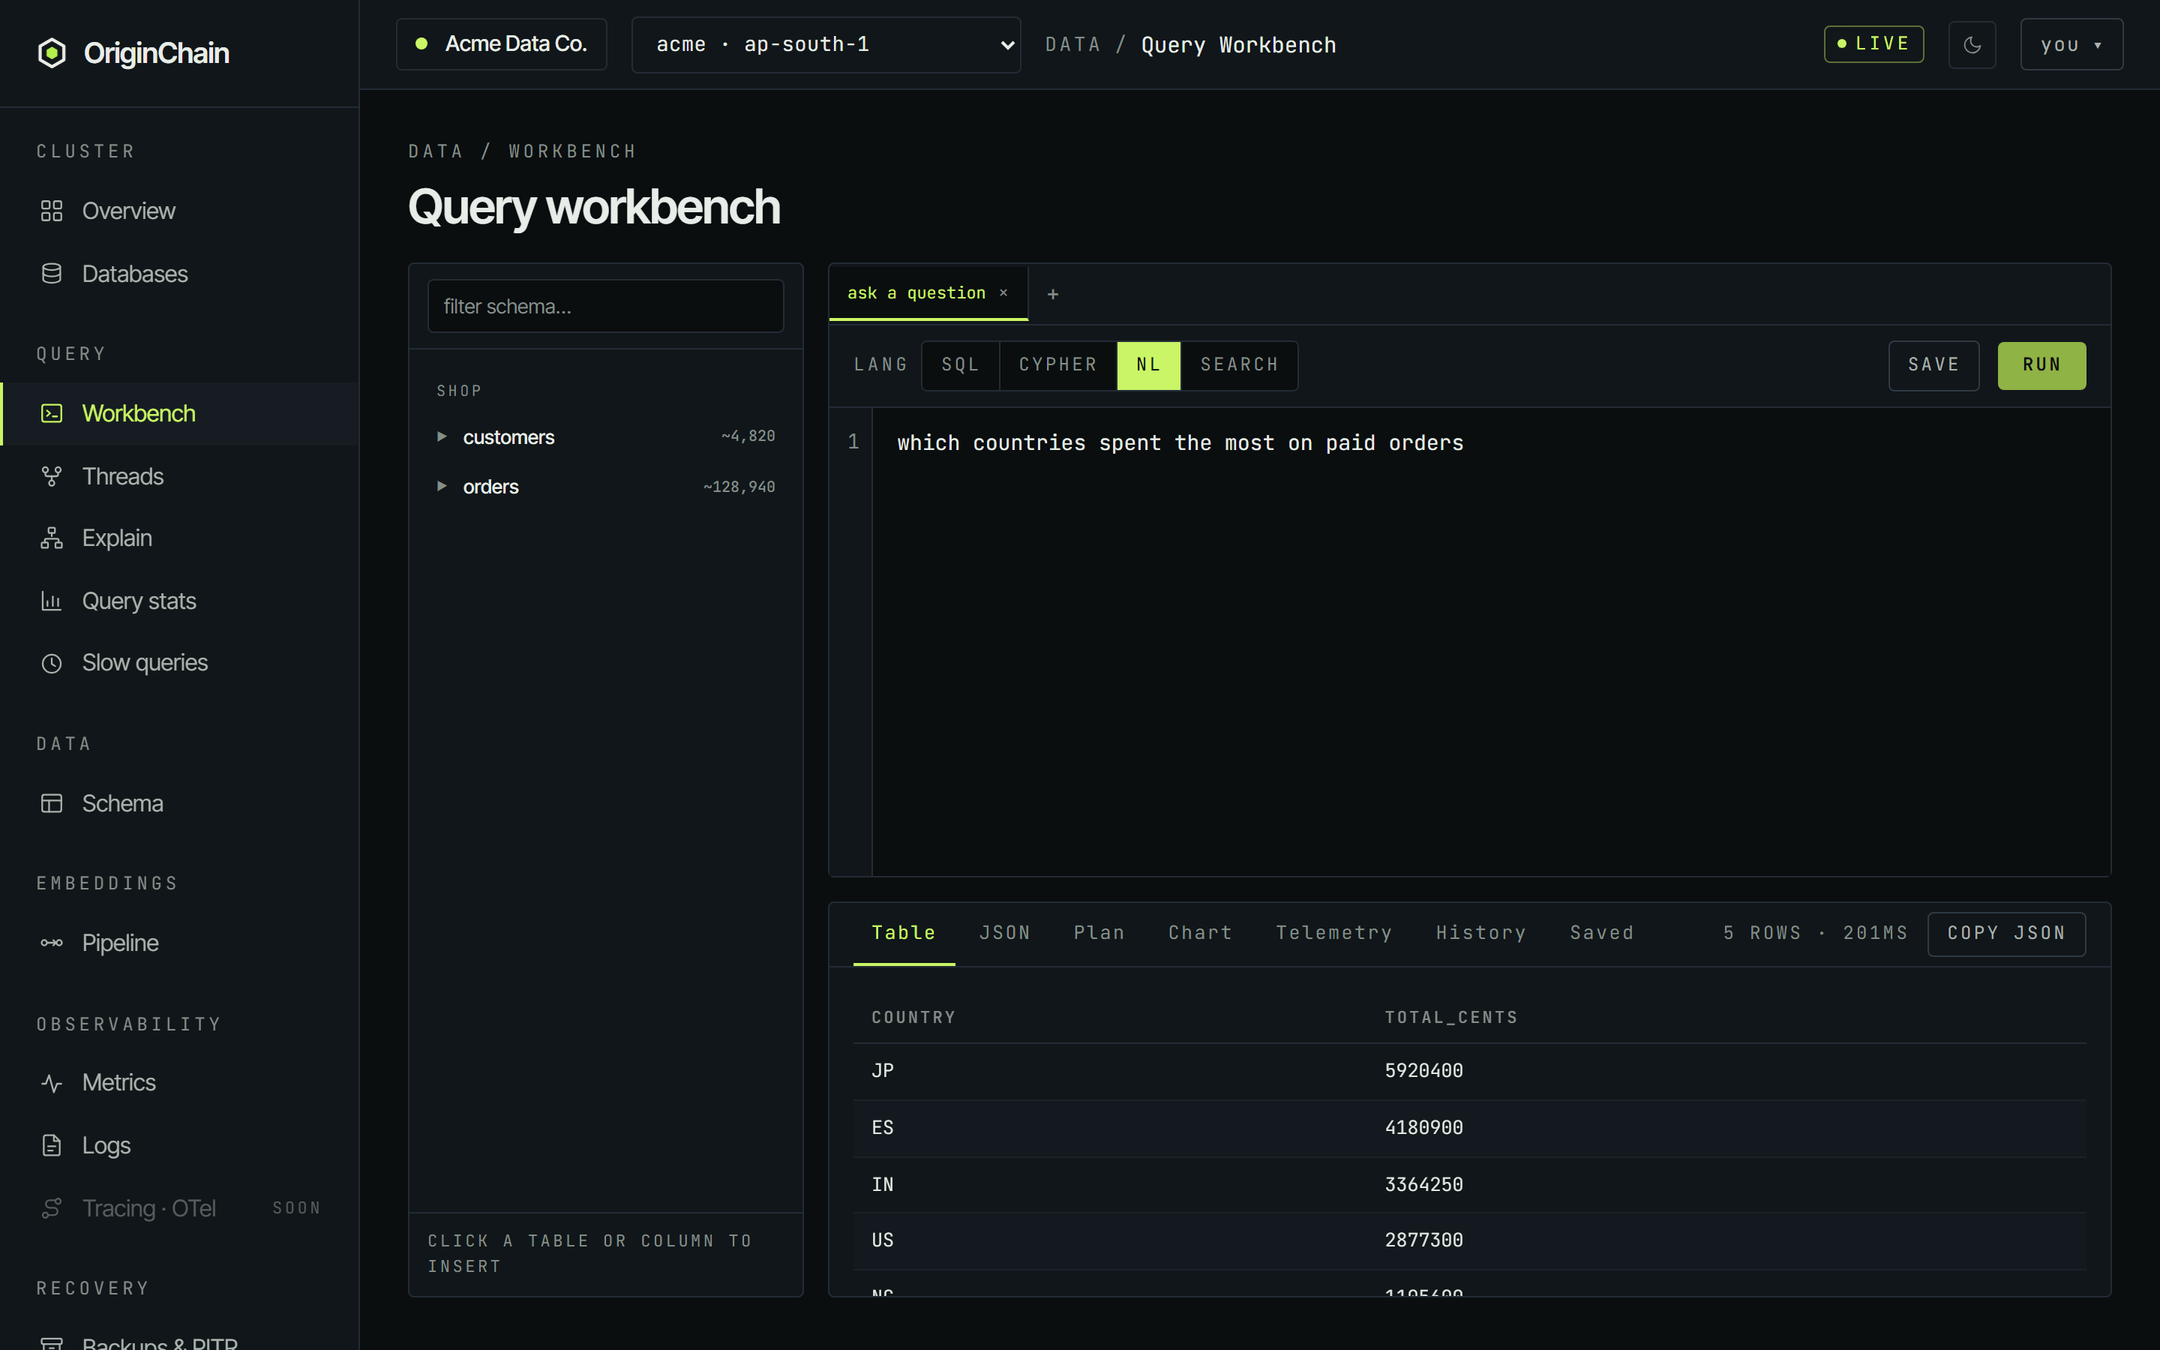
The workbench shows you the answer, not the query it compiled. There is no "show the SQL it wrote" toggle in the console today, and the Plan tab does not fill in for an NL run. What you can see is the raw response in the JSON tab, which carries the rows plus a cache field telling you whether the question was answered from a cached compilation.
Natural language is a paid feature. When the instance selected in the top bar is a free database the NL button is not shown at all - the switcher reads SQL / Cypher / Search - and any tab that was left on NL falls back to SQL. Select a paid instance in the top bar and the button reappears.
Search - BM25 full-text.
For "find the rows whose text mentions this". Search mode is not SQL - it takes one line in the shape the console itself documents:
table:field one or more query terms

shop.orders:notes rush delivery
^^^^^^^^^^^ ^^^^^ ^^^^^^^^^^^^^
   table    field     terms
A colon separates the fully-qualified table from the indexed field; the first space after the field separates the field from the query terms. Get the shape wrong and the workbench answers with the syntax line itself rather than running anything. The field has to have been indexed for full text - notes here carries the TXT chip in the schema rail.
shop.orders:notes rush delivery
Results are ranked hits rather than table rows: rank, doc_id (the primary key of the matching row), score, and a snippet. Higher scores rank first. The snippet carries the highlight markers verbatim - you will see literal <em> tags around the matched terms in the table, which is how you can tell which terms actually hit.
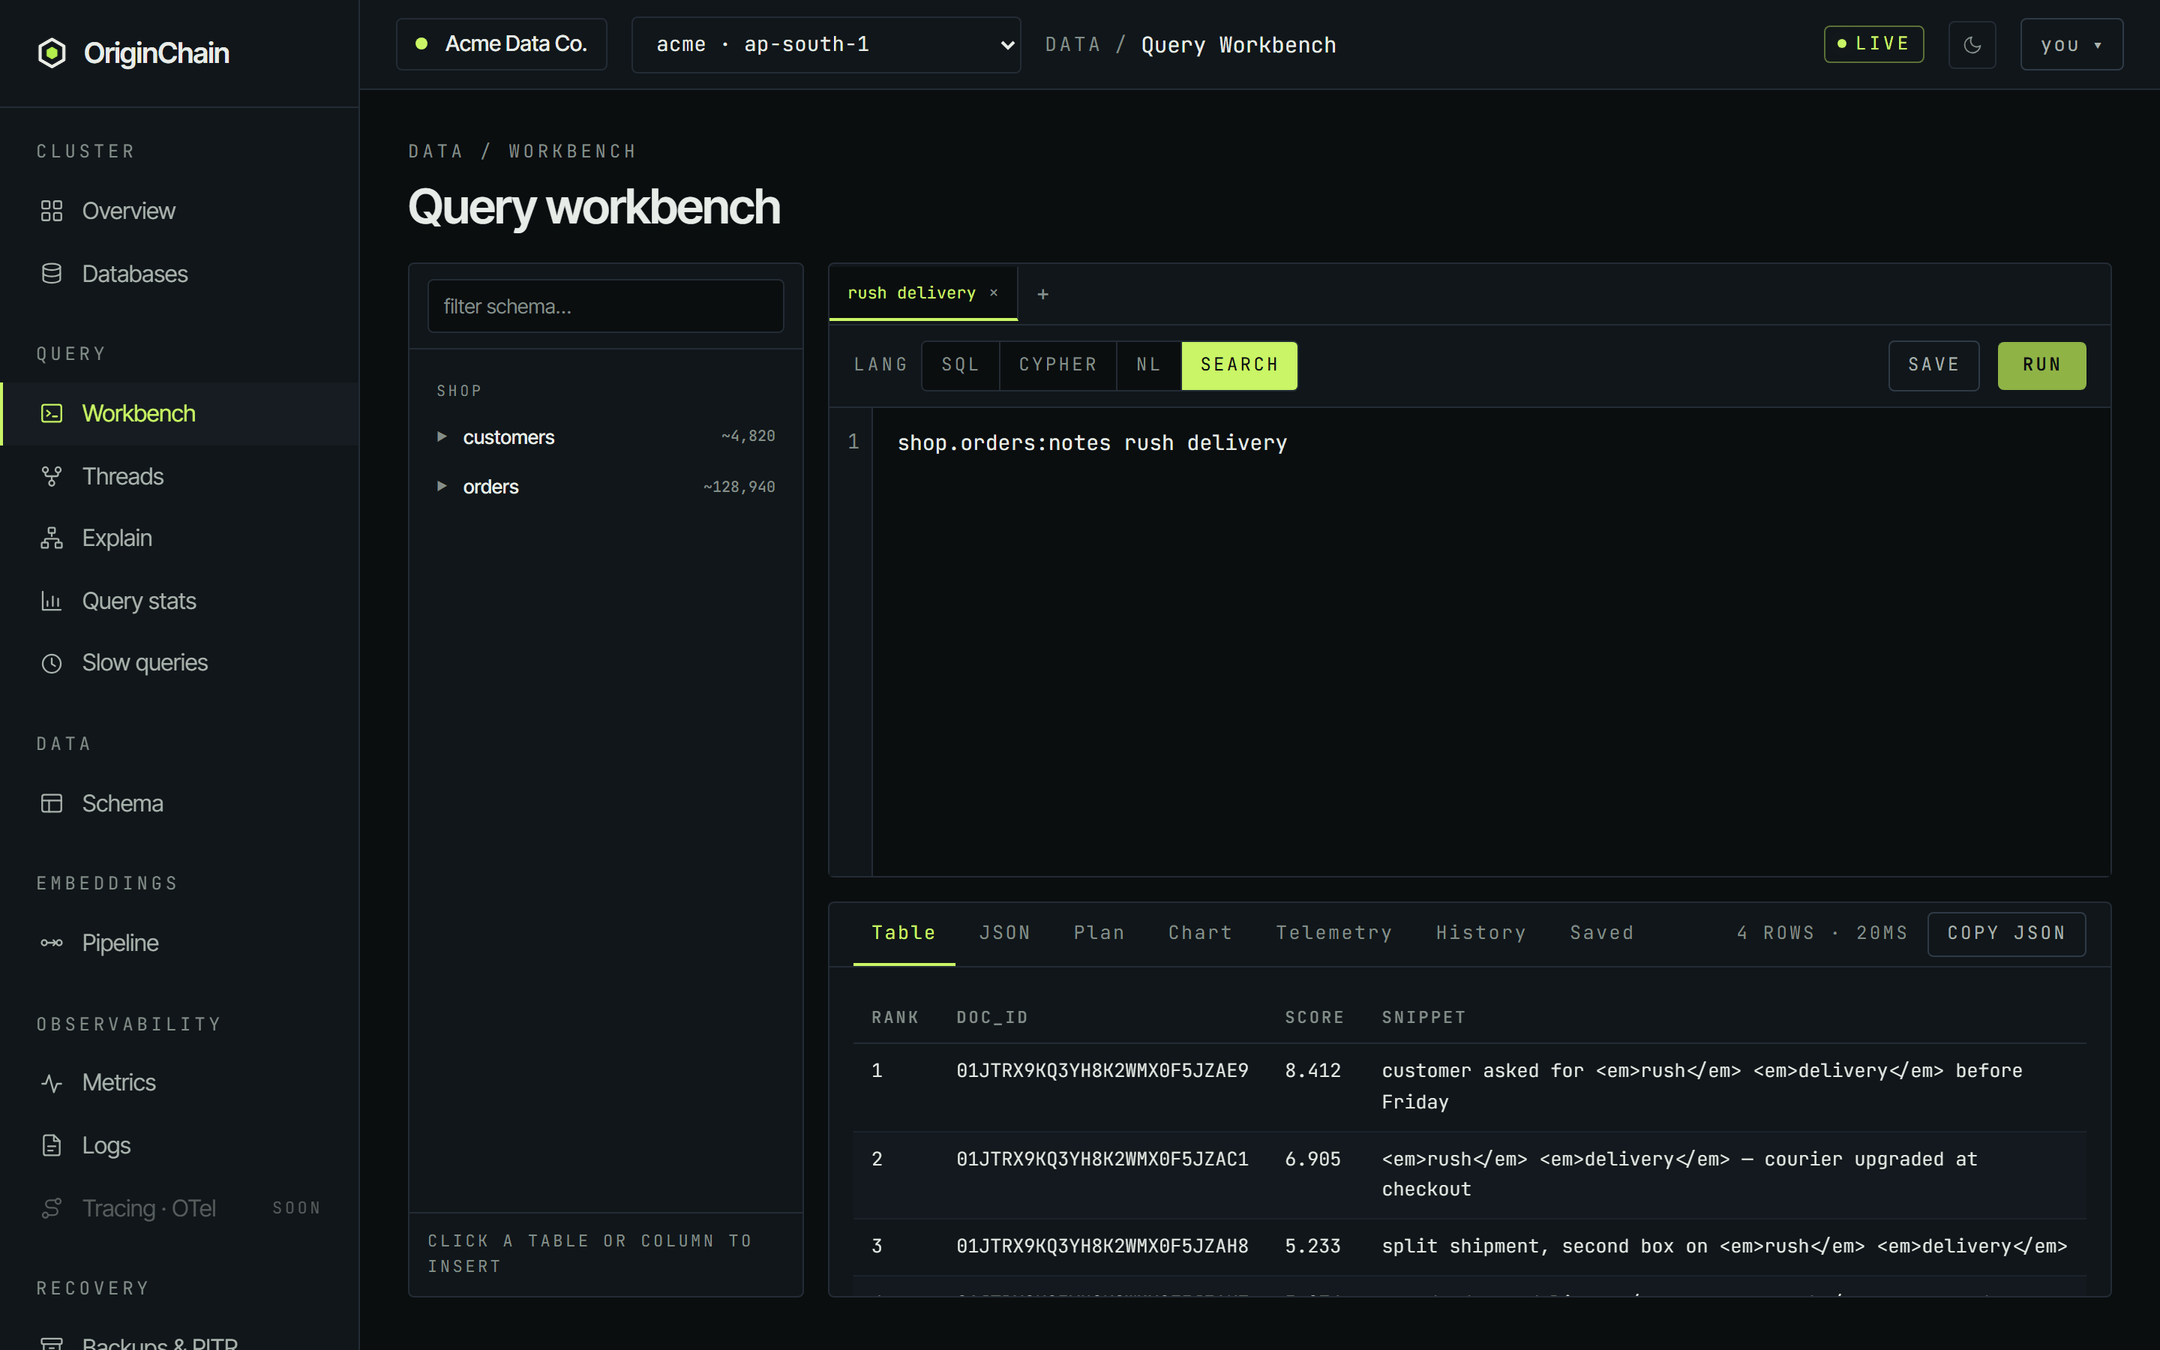
Search mode always asks the engine for BM25 ranking, which requires the FTS Pro add-on on that instance. Enable it from Billing → Add-ons.
Where vector search lives.
The workbench has no vector mode. The LANG switcher offers SQL, Cypher, NL and Search, and that is the whole list - a nearest-neighbour query needs a query embedding, which is not something you can usefully type into a text editor.
What the dashboard does own for vectors is the index: on Data → Schema you can train and install a vector index over a table that already holds vectors. Running the search itself is an API or SDK call - see Vector search for the endpoint and the client examples, and the quickstart for a working top-k in cURL, Python, TypeScript and Go.
Standalone vector tables do show up in the workbench's schema rail under a vector tables heading with their vector count, so you can confirm what has been indexed without leaving the page.
Reading the results panel.
Whichever mode you ran, the answer arrives in the same panel below the editor. Three of its tabs matter for a single query - the rest are covered in Workbench in depth.
| Tab | What it shows |
|---|---|
| Table | The default. One column per result column, paged 20 rows at a time. Nulls render as a dim dash. |
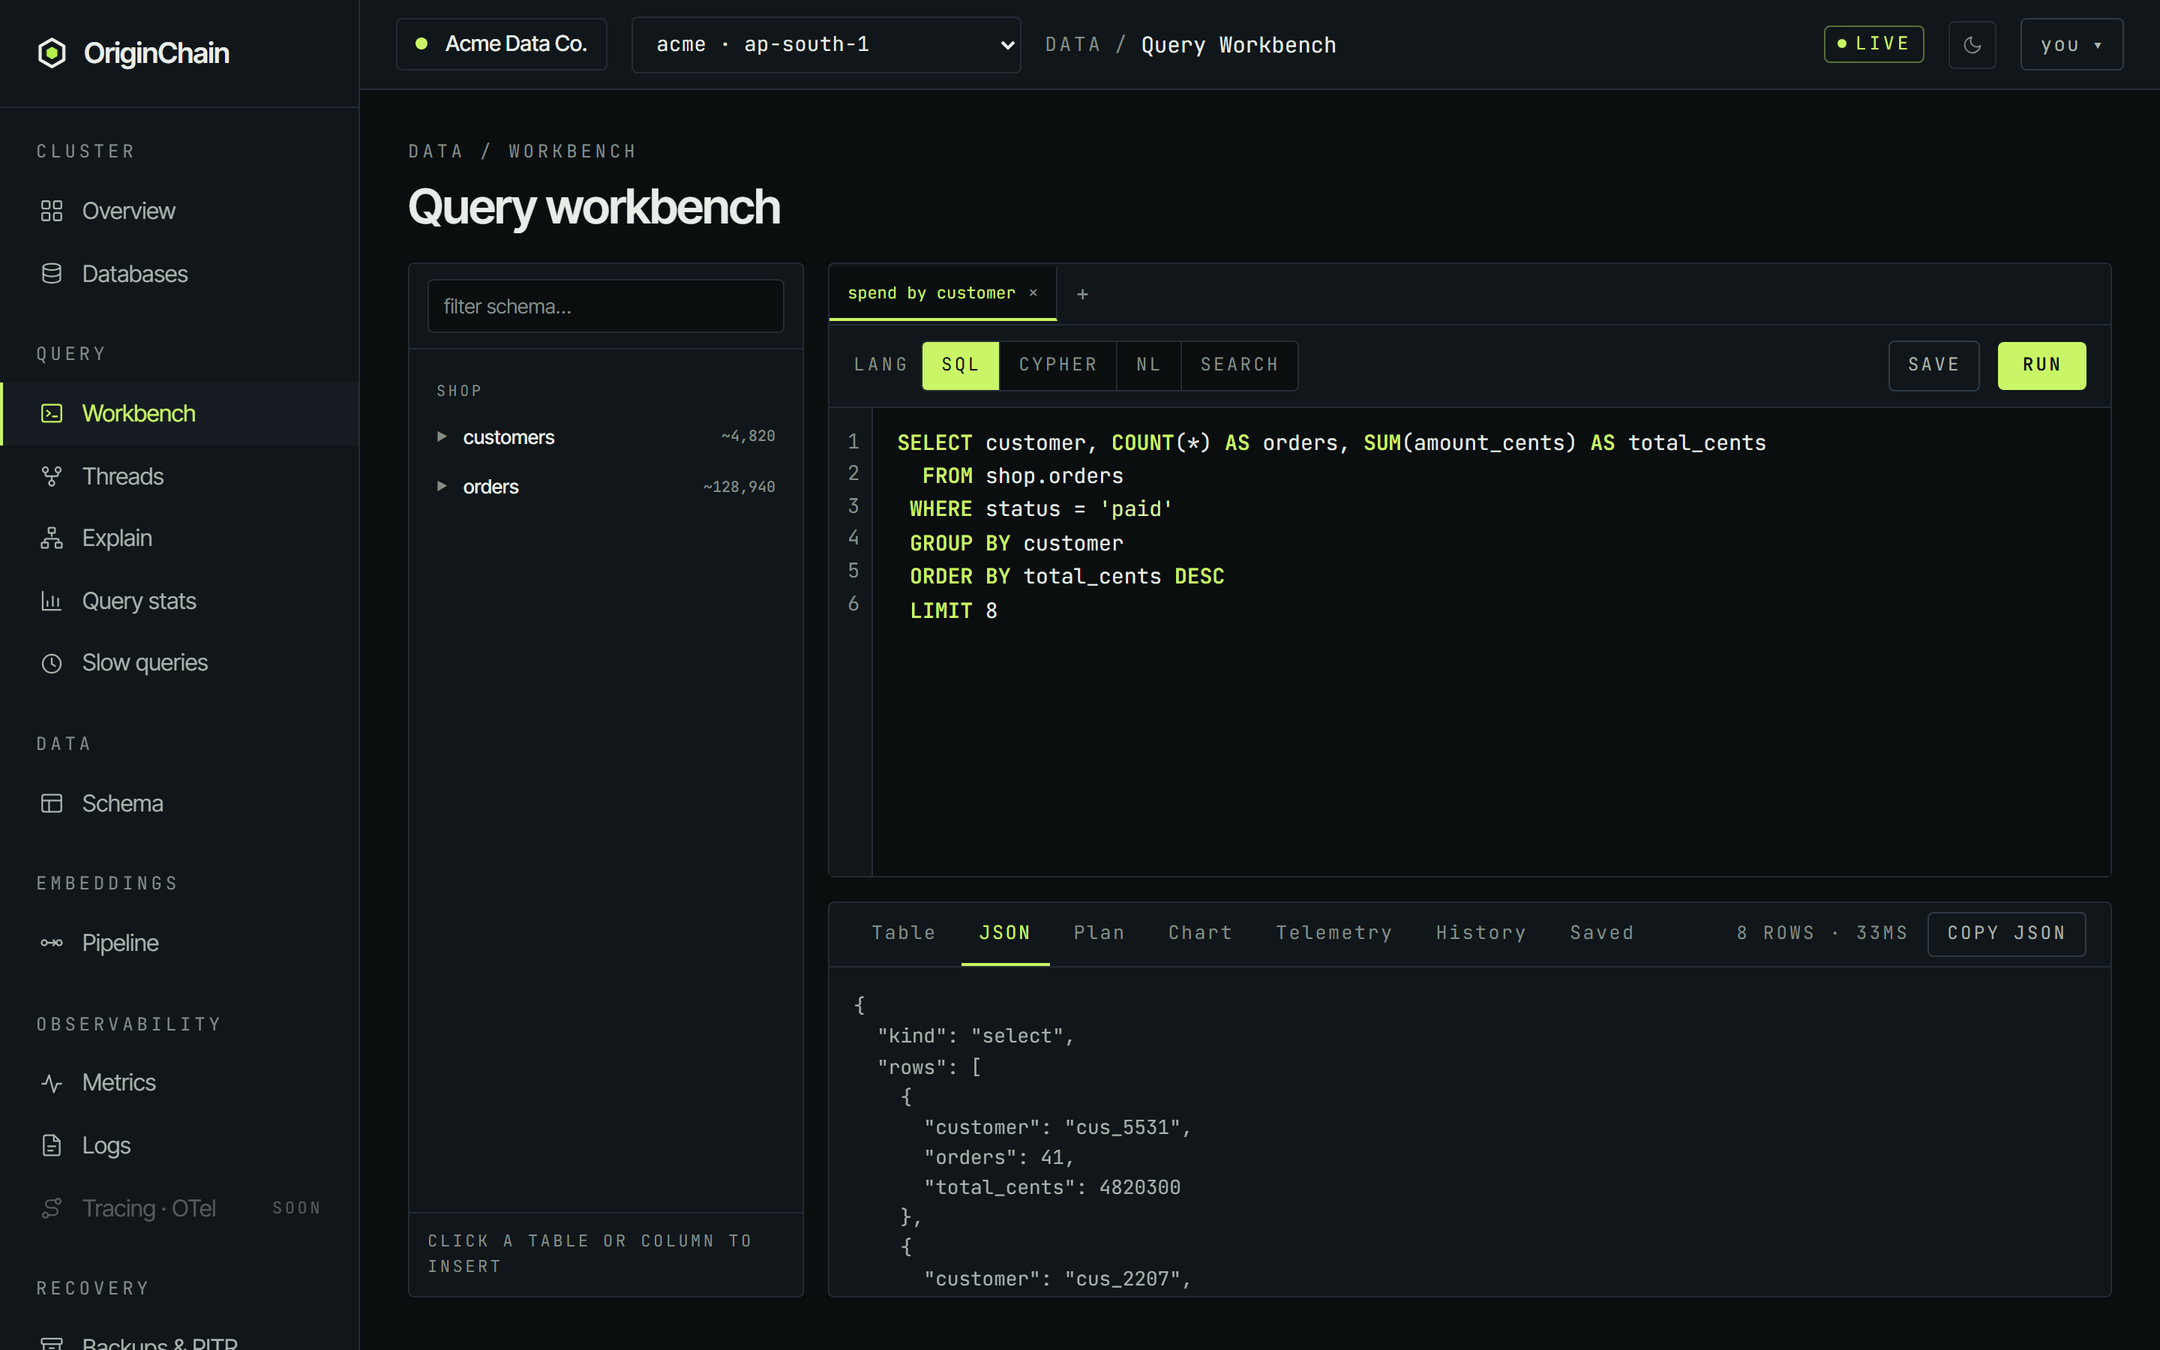
| JSON | The raw response body, exactly as the engine returned it - envelope included. Use Copy JSON (top right, appears after the first run) to take the whole result set, not just the visible page. |
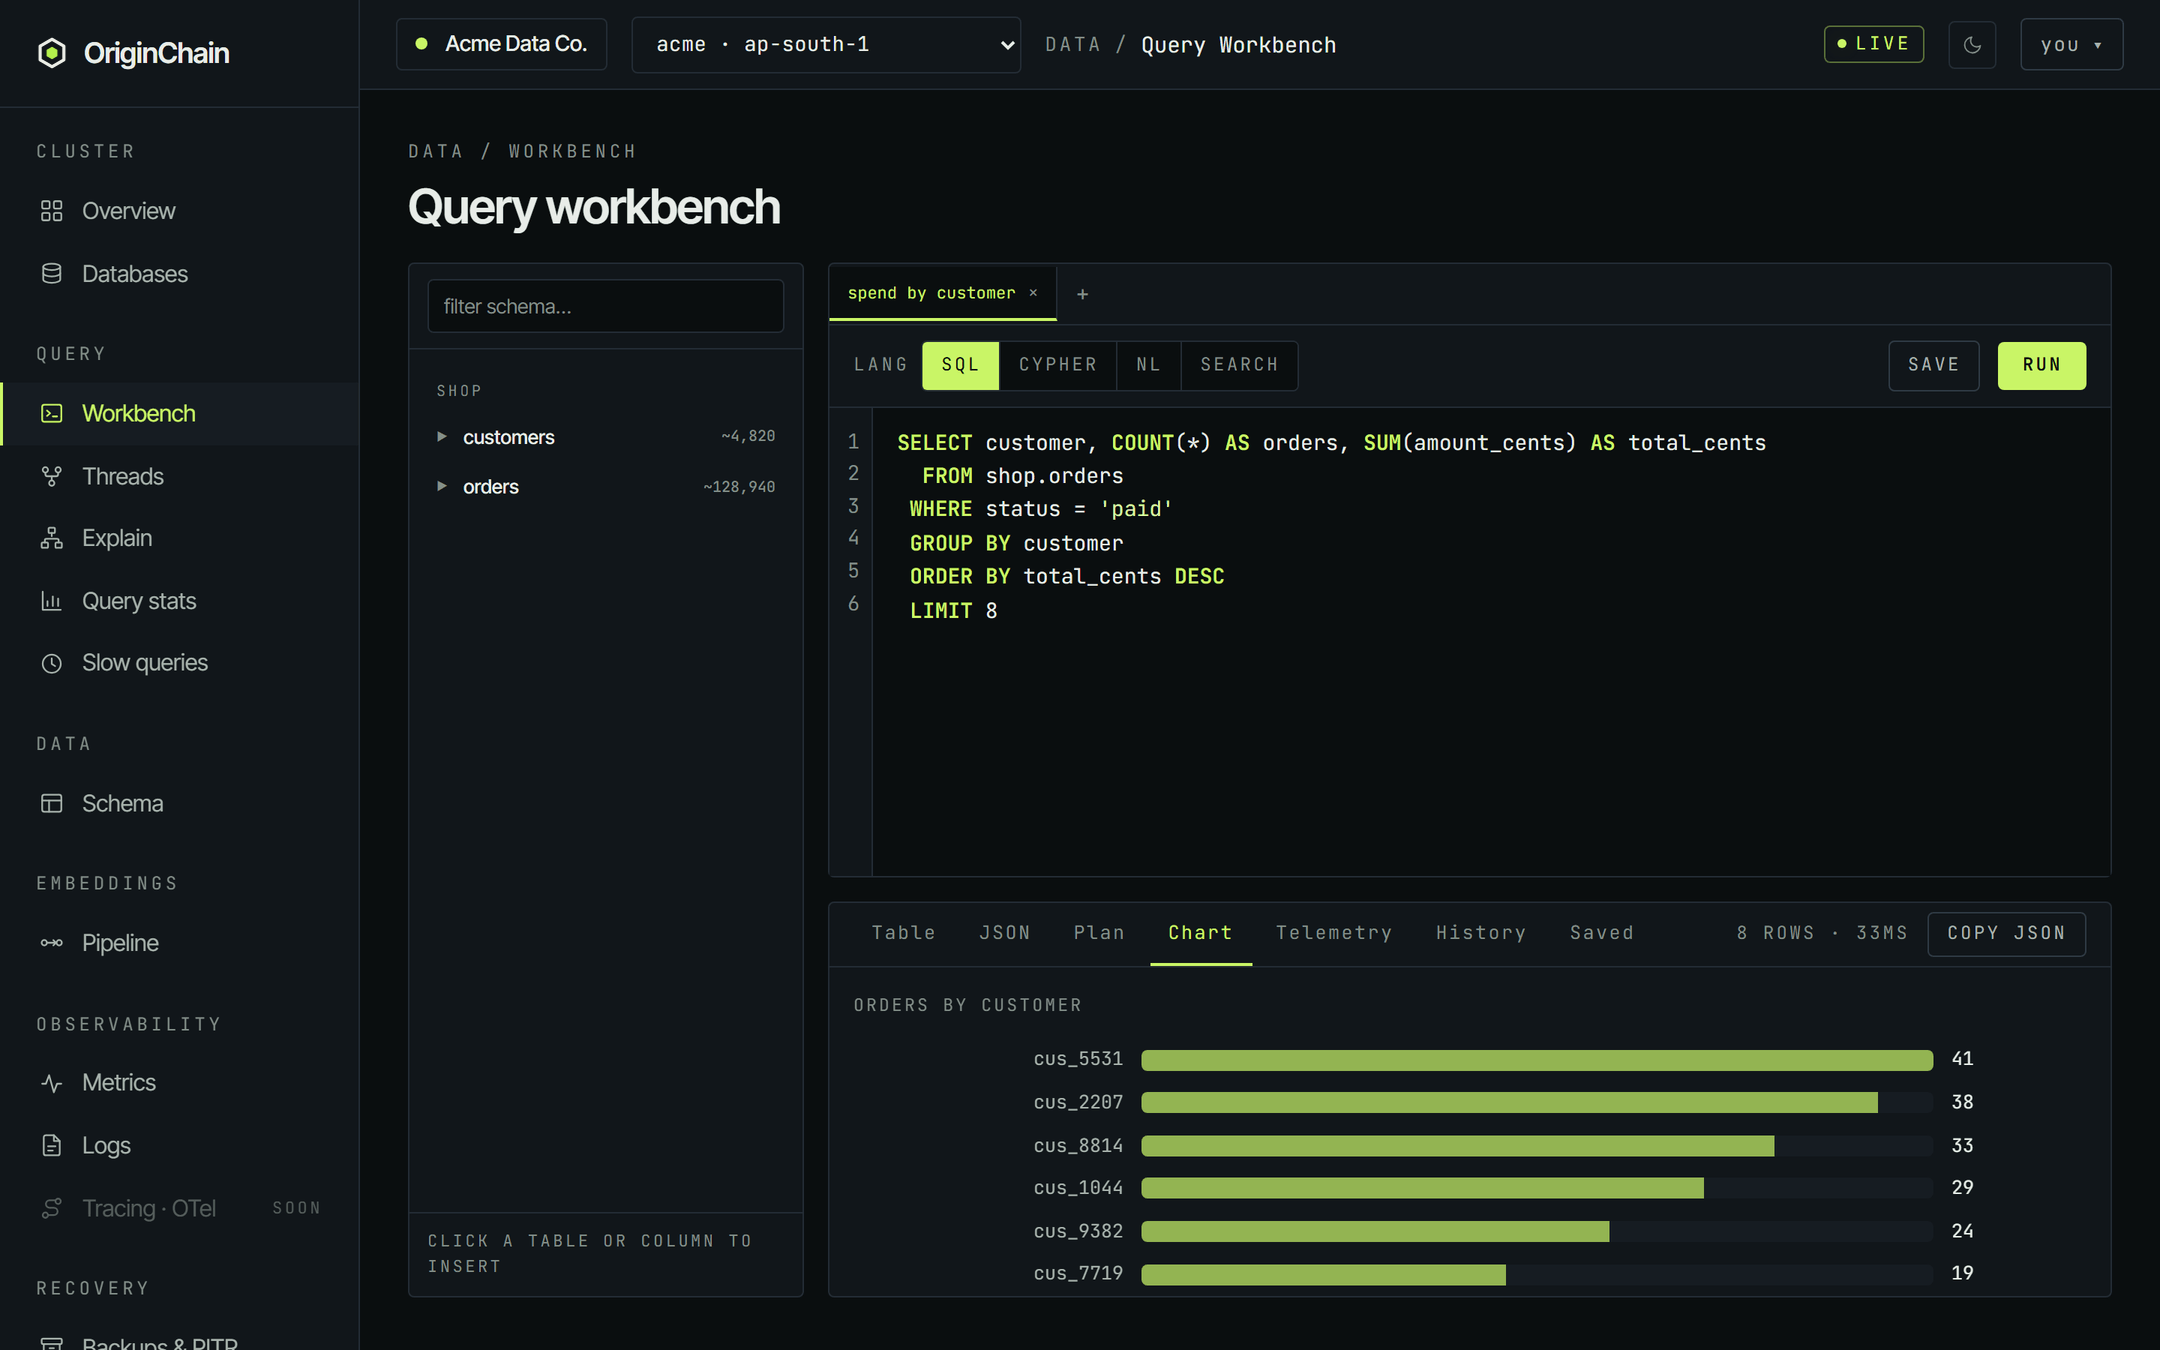
| Chart | A horizontal bar chart, drawn automatically when the result has something to plot. It labels bars with the first text column and measures the first column that is numeric in every row, capped at the first 20 rows. |
The JSON tab is the honest view: it is what your application would receive from the same query, so it is the right thing to look at when you are about to move a query into code.
When to stop and use the API instead.
The workbench holds the whole result in the browser. Keep a LIMIT on exploratory queries and pull bulk data with the SDKs or the HTTP API.
Nearest-neighbour queries, anything that needs an embedding, and anything you want to run with bound parameters belong in a client. The workbench is for reading and shaping a query; the SDK is for running it in anger.